Operations | Monitoring | ITSM | DevOps | Cloud

May 2018

Less Toil, More Coil - Telemetry Analysis with Python

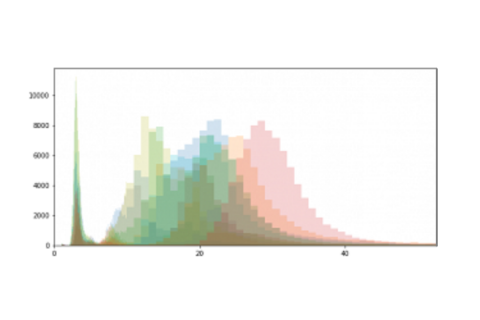
This was a frequent request we were hearing from many customers: "How can I analyze my data with Python?" The Python Data Science toolchain (Jupyter/NumPy/pandas) offers a wide spectrum of advanced data analytics capabilities. Therefore, seamless integration with this environment is important for our customers who want to make use of those tools.

Cassandra Query Observability with Libpcap and Protocol Observer

Opinions vary in recent online discussions regarding systems and software observability. Some state that observability is a replacement for monitoring. Others that they are parallel mechanisms, or that one is a subset of another (not to mention where tracing fits into such a hierarchy). Monitoring Weekly recently provided a helpful list of resources for an overview of this discussion, as well as some practical applications of observability.

Effective Management of High Volume Numeric Data with Histograms

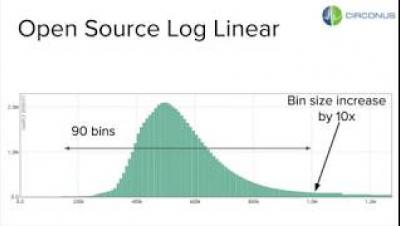
How do you capture and organize billions of measurements per second such that you can answer a rich set of queries effectively (percentiles, counts below X, aggregations across streams), and you don’t blow through your AWS budget in minutes? To effectively manage billions of data points, your system has to be both performant and scalable. How do you accomplish that? Not only do your algorithms have to be on point, but your implementation of them has to be efficient.

Linux System Monitoring with eBPF

The Linux kernel is an abundant component of modern IT systems. It provides the critical services of hardware abstraction and time-sharing to applications. The classical metrics for monitoring Linux are among the most well known metrics in monitoring: CPU utilization, memory usage, disk utilization, and network throughput. For a while now, Circonus installations have organized, the key system metrics in the form of a USE Dashboard, as a high level overview of the system resources.