Operations | Monitoring | ITSM | DevOps | Cloud

Latest News

The Best Strategy For Microsoft 365 Performance

In today’s lightning-fast world, seamless teamwork and communication are like oxygen for any company. And that’s where having a strategy for Microsoft 365 performance gives you an edge. It’s the epicenter of collaboration within the Microsoft 365 universe. It helps teams connect, build, and crush their goals. But, keeping Microsoft Teams purring like a kitten is essential to avoid revenue hiccups.

Linux Netstat Command - How To Use Netstat For Linux Network Management

Netstat is a powerful command-line tool that provides valuable insights into your computer's network connections and performance. This article will explore what netstat does, how to use it on Linux systems, and ways to leverage netstat for network troubleshooting and monitoring.

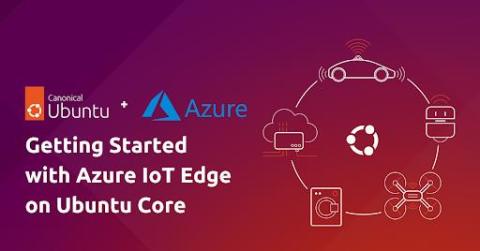
Getting Started with Azure IoT Edge on Ubuntu Core

Earlier this month/week, we announced that you can now benefit from the combined power of Ubuntu Core and Azure IoT Edge to bring the computation, storage, and AI capabilities of the cloud closer to the edge of the network. Azure IoT Edge is a device-focused runtime that enables you to deploy, run, and monitor containerised Linux workloads. Ubuntu Core is a version of Ubuntu that has been specially optimised for IoT and embedded systems.

A Comprehensive Guide to IT Capacity Planning

Effective capacity planning and management are fundamental to maintaining a robust IT infrastructure, helping teams optimize available resources to meet performance needs. In this guide, we’ll walk you through everything you need to know about these invaluable processes to ensure your organization’s IT infrastructure is prepared for current and future demands.

Where's the money? The ROI of test data management

You may have heard of test data management (TDM). It’s part of the software delivery process – some would say a crucial part, involving the creation, management, and maintenance of environments for software development and testing. By provisioning fresh, production-like data, it allows developers to test their proposed changes early, thoroughly, and repeatedly with the right test data, when they need it and where they need it.

How to enhance network monitoring: 3 anomaly detection use cases

In the LM Envision platform, anomaly detection for metrics is referred to by the feature name “Dynamic Threshold” rather than the more generic machine learning term “anomaly detection.” Dynamic thresholds allow users to identify and set custom alert thresholds based on observed data points. Metric thresholds in rules-based systems are effective when the desired outcome is clear. However, static thresholds may not anticipate emerging issues.

Maximize IT efficiency leveraging alert management with Elastic AI Assistant for Observability

Manage and correlate signals and alerts in Elastic Observability As organizations embrace increasingly complex and interconnected IT systems, the sheer volume of alerts generated by diverse monitoring tools has given rise to a critical challenge — how do we efficiently sift through the noise to identify and respond to the most crucial issues? Event management and correlation are two indispensable pillars in the realm of IT service management.

OpenTelemetry distributed tracing with eBPF: What's new in Grafana Beyla 1.3

Grafana Beyla, an open source eBPF auto-instrumentation tool, has been able to produce OpenTelemetry trace spans since we introduced the project. However, the traces produced by the initial versions of Grafana Beyla were single span OpenTelemetry traces, which means the trace context information was limited to a single service view. Beyla was able to ingest TraceID information passed to the instrumented service, but was unable to propagate it upstream to other services.

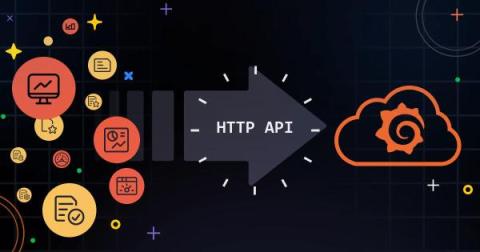
How to use HTTP APIs to send metrics and logs to Grafana Cloud

Integrating monitoring and logging into your application stack is crucial for maintaining performance, enhancing security, and streamlining troubleshooting. Grafana Cloud offers a robust solution for monitoring your applications by collecting metrics and logs using an agent, such as Grafana Agent, but there are many environments where this isn’t feasible.