Operations | Monitoring | ITSM | DevOps | Cloud

Logging

The latest News and Information on Log Management, Log Analytics and related technologies.

Mastering Observability with OpenSearch: A Comprehensive Guide

Observability is the ability to understand the internal workings of a system by measuring and tracking its external outputs. In technical terms, it entails collecting and examining data from numerous sources within a system to attain insights into its behavior, performance, and health. All organizations are now familiar with how essential observability is to ensure optimal performance and availability of their IT infrastructure.

Navigating the Mainframe Logging Maze: Insights for the Modern IT Professional

Mainframes might seem like relics of a bygone era to many of us in 2024, but the truth, however, is far from that. Despite their reputation as ancient behemoths—and frequent targets of jokes—mainframes continue to be vital powerhouses driving the global economy. Their capability to process billions of transactions daily, including the majority of credit card transactions, underscores their enduring significance.

The Top 15 Real-Time Dashboard Examples

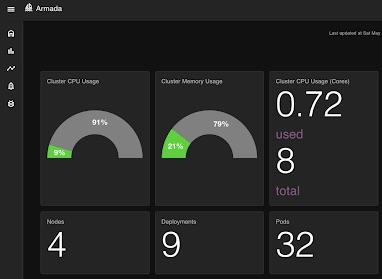
Monitoring your data with dashboards and visualizations is perfect for improving the efficiency of your team and facilitating data-driven decisions from insights. They provide a different perspective to your data and by utilizing this data and trends you can clearly view if your system, application, or server is performing optimally, and if it isn’t performing as expected you can analyze where the issue is and promptly rectify this.

Revealing unknowns in your tracing data with inferred spans in OpenTelemetry

In the complex world of microservices and distributed systems, achieving transparency and understanding the intricacies and inefficiencies of service interactions and request flows has become a paramount challenge. Distributed tracing is essential in understanding distributed systems. But distributed tracing, whether manually applied or auto-instrumented, is usually rather coarse-grained.

Open-source Telemetry Pipelines: An Overview

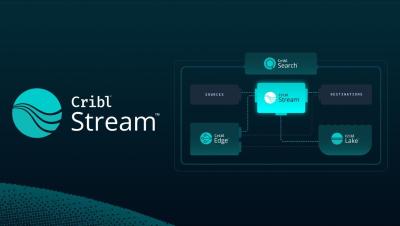
Imagine a well-designed plumbing system with pipes carrying water from a well, a reservoir, and an underground storage tank to various rooms in your house. It will have valves, pumps, and filters to ensure the water is of good quality and is supplied with adequate pressure. It will also have pressure gauges installed at some key points to monitor whether the system is functioning efficiently. From time to time, you will check pressure, water purity, and if there are any issues across the system.

Sumo Logic Flex Pricing: Is usage pricing a good idea?

When discussing observability pricing models, there are three dimensions that must be considered The first, Cost per Unit, is an easy-to-understand metric, but in practice it is often overshadowed by a lack of transparency and predictability for other costs. The question is simple: how does a usage based pricing model impact these variables?

How To Harness the Full Potential of ELK Clusters

The ELK Stack is a collection of three open-source projects, Elasticsearch, Logstash, and Kibana. They operate together to centralize and examine logs and other types of machine-generated data in real time. With the ELK stack, you can utilize clusters for effective log and event data analysis and other uses. ELK clusters can provide significant benefits to your organization, but the configuration of these clusters can be particularly challenging, as there are a lot of aspects to consider.

Structure of Logs (Part 2) | Zero to Hero: Loki | Grafana

Have you just discovered Grafana Loki? Zero to Hero: Loki is a series of videos that aims to take you through the basics of ingesting, your logs into Grafana Loki an open-source log aggregation solution. In this episode, it's all about the structure of logs. In part 2 we cover the different ways a log can be formatted. ☁️ Grafana Cloud is the easiest way to get started with Grafana dashboards, metrics, logs, and traces. Our forever-free tier includes access to 10k metrics, 50GB logs, 50GB traces and more. We also have plans for every use case.

Why Organizations are Using Grafana + Loki to Replace Datadog for Log Analytics

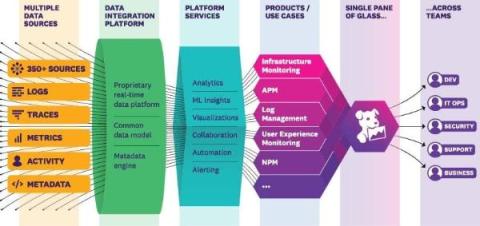
Datadog is a Software-as-a-Service (SaaS) cloud monitoring solution that enables multiple observability use cases by making it easy for customers to collect, monitor, and analyze telemetry data (logs, metrics and traces), user behavior data, and metadata from hundreds of sources in a single unified platform.