Operations | Monitoring | ITSM | DevOps | Cloud

Monitoring

The latest News and Information on Monitoring for Websites, Applications, APIs, Infrastructure, and other technologies.

Revealing unknowns in your tracing data with inferred spans in OpenTelemetry

In the complex world of microservices and distributed systems, achieving transparency and understanding the intricacies and inefficiencies of service interactions and request flows has become a paramount challenge. Distributed tracing is essential in understanding distributed systems. But distributed tracing, whether manually applied or auto-instrumented, is usually rather coarse-grained.

Sumo Logic Flex Pricing: Is usage pricing a good idea?

When discussing observability pricing models, there are three dimensions that must be considered The first, Cost per Unit, is an easy-to-understand metric, but in practice it is often overshadowed by a lack of transparency and predictability for other costs. The question is simple: how does a usage based pricing model impact these variables?

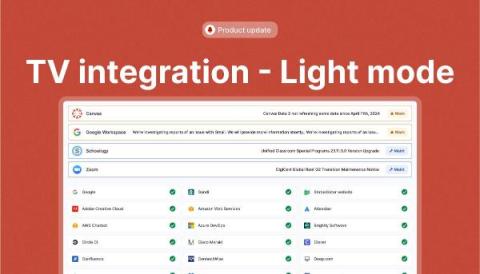
TV integration - introducing the Light mode

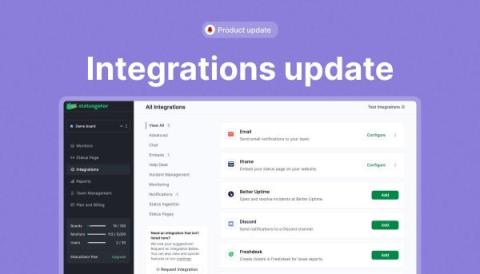
We just launched a new feature requested by a new users: a light mode for our TV integration. As a reminder, the TV integration is a specially-formatted version of your status page designed to display on a TV. The new light mode is a useful addition that can enhance the readability of your status page on large screens in certain lighting conditions. Or, if you rotate your display with several other screens which have similar light styles, you can now enjoy a better level of consistency across screens.

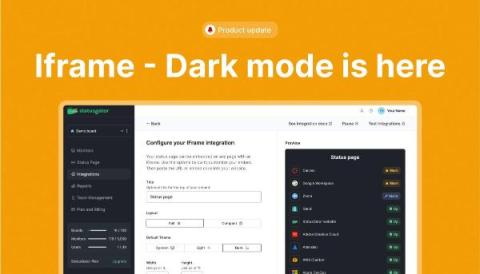
Iframe integration - meet Dark mode

Meet another update for our Iframe integration! What’s changed? This update brings a dark-mode option for users whose websites or portals are designed with a dark theme in mind. With dark mode for Iframe integration, you now have the flexibility to ensure that your embedded status pages align perfectly with the aesthetic of your website or portal and that your text is readable.

Postgres performance monitoring: Best practices and key metrics

Before diving into how to ensure the reliability, availability, and optimal performance of your PostgreSQL database, it’s essential to understand the necessity of constant vigilance for its maintenance. This vigilance forms the backbone of a healthy PostgreSQL database. So, how exactly can you achieve this? The answer lies in comprehensive Postgres monitoring.
Sponsored Post

Navigating Industry-Specific Challenges in IT Infrastructure Monitoring and Automation

In navigating the intricate landscape of IT infrastructure, NiCE IT Management Solutions' whitepaper delves deep, unraveling the historical tapestry shaping the contemporary technological terrain. It dissects industry-specific challenges, offers tailored insights into crafting monitoring and automation solutions, and spotlights key players' pivotal roles. Real-world applications showcase how these technologies drive operational excellence, emphasizing the necessity of skillful guidance through monitoring and automation in today's business environments.

How To Harness the Full Potential of ELK Clusters

The ELK Stack is a collection of three open-source projects, Elasticsearch, Logstash, and Kibana. They operate together to centralize and examine logs and other types of machine-generated data in real time. With the ELK stack, you can utilize clusters for effective log and event data analysis and other uses. ELK clusters can provide significant benefits to your organization, but the configuration of these clusters can be particularly challenging, as there are a lot of aspects to consider.