Operations | Monitoring | ITSM | DevOps | Cloud
November 2023
Diving into JTAG - Overview (Part 1)
As the first segment of a three-part series on JTAG, this post will give an overview of JTAG to set up some more in-depth discussions on debugging and JTAG Boundary-Scan. We will dive into the intricacies of the interface, such as the Test Access Port (TAP), key registers, instructions, and JTAG’s finite state machine. Like Interrupt? Subscribe to get our latest posts straight to your inbox.
Monitor More of Your IT Infrastructure
Navigating the New SEC Data Breach Rule A Blameless Blueprint for Compliance
Memcached Metrics Monitoring with OpenTelemetry
How to Monitor MongoDB Metrics with OpenTelemetry
Sysdig Achieves the Amazon EKS Ready Designation
Today Sysdig has been recognized for achieving the Amazon Elastic Kubernetes Service (Amazon EKS) Ready designation from Amazon Web Services (AWS). This specialization recognizes that the Sysdig cloud-native application protection platform (CNAPP) is validated by AWS Partner Solutions Architects to integrate with Amazon EKS and Amazon EKS Anywhere. Amazon EKS Ready Partners like Sysdig offer AWS customers the ability to customize the Kubernetes solution to fit their business needs.
PagerDuty Named a Leader in GigaOm's Inaugural 2023 Incident Response Platforms Radar Evaluation
In a world where organizations of all industries increasingly rely on digital innovation and experiences to create differentiation in the market, it has never been more critical to ensure the integrity of their operations are safeguarded against unforeseen outages and incidents. Operational disruptions today can have a major impact on brand reputation, create negative revenue implications and impact customer loyalty.
What's Stopping the Adoption of Network Automation?
Is there a gap between the potential of network automation and widespread industry implementation? Phil Gervasi explores how the adoption challenges of network automation are multifaceted and aren’t all technical in nature.
What is Zero Trust and How IT Infrastructure Monitoring (ITIM) Makes it Happen
When the concept of Zero Trust emerged in 2010, it marked a sea change in how IT and network security are handled. The term, invented by Forrester Research analyst John Kindervag, is loosely based on the “never trust, always verify” motto. So why is this a sea change? Before 2010, IT focused on perimeter defenses and the concept of DMZs — areas of the network they deemed safe based on the protection they implemented.
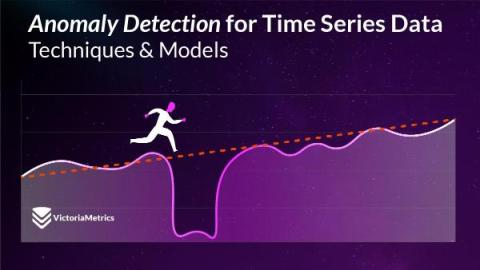
Anomaly Detection for Time Series Data: Techniques and Models
Welcome to the third chapter of the handbook on Anomaly Detection for Time Series Data! This series of blog posts aims to provide an in-depth look into the fundamentals of anomaly detection and root cause analysis. It will also address the challenges posed by the time-series characteristics of the data and demystify technical jargon by breaking it down into easily understandable language.


