

|
By Prashant Shahi
Kubernetes has since emerged as “THE” container orchestration platform for deploying and managing containerized workloads as a result of its robust capabilities. However, the complexity of its architecture and its dynamic nature present significant challenges in monitoring deployed workloads and the platform itself. Kubernetes monitoring is crucial for maintaining the health, performance, and reliability of containerized applications.

|
By Favour Daniel
Information about the containers and pods on your cluster may be obtained using the kubectl logs command. These logs allow you to know the performance of your applications, whether they are failing or healthy, and are particularly useful for debugging and troubleshooting purposes. In this article, we will see how to use the kubectl logs command to get information from existing resources in a Kubernetes cluster. Before we dive in, let's first take a quick look Kubernetes architecture and logging.

|
By Favour Daniel
Kubernetes is a powerful orchestration tool for managing containers, but it comes with its own set of challenges. One of the biggest hurdles is effectively logging what's happening in your system. As your applications grow and spread across clusters, keeping track of their behavior becomes crucial. In this article, we will discuss logging in Kubernetes, common Kubernetes log types, and how logs can be effectively tracked and managed.

|
By Ankit Anand
In microservices architecture, observability tools enable you to create central dashboards to gauge the health of your distributed systems. New age observability tools have shifted to providing quick workflows to debug application issues. In this post we will explore top 11 observability tools that you can consider to use for your software systems. In today's digital economy, distributed architectures have become the norm.

|
By Favour Daniel
Kubectl Top command can be used to retrieve snapshots of resource utilization of pods or nodes in your Kubernetes cluster. Resource utilization is an important thing to monitor for Kubernetes cluster owners. In order to monitor resource utilization, you can keep track of things like CPU, memory, and storage. In this article, we will see how to use kubectl Top command to get and read metrics about pods and nodes. We will also breakdown the output to understand what it means.

|
By Favour Daniel
The kubectl logs tail command is a tool that allows users to stream the logs of a pod in real-time while using Kubernetes. This command is particularly useful for debugging and monitoring applications, as it enables users to view log output as it is generated and quickly identify any issues or problems with their application. In this article, we will see how to use the kubectl logs tail command to stream logs, the benefits of using the command, and an advanced tool for streaming logs.

|
By Ankit Anand
Welcome to SigNal 36, the 36th edition of our monthly product newsletter! We crossed 10 Million Docker downloads for our open source project. We’ve enhanced our Dashboards UX and incorporated feedback from users in different areas of our product. Let’s see what humans of SigNoz were up to in the month of April 2024.

|
By Ankit Anand
Both Grafana Tempo and Jaeger are tools aimed at distributed tracing for microservice architecture. Jaeger was released as an open-source project by Uber in 2015, while Tempo is a newer product announced in October 2020. Jaeger is a popular open-source tool that graduated as a project from Cloud Native Computing Foundation. Grafana Tempo is a high-volume distributed tracing tool deeply integrated with other open-source tools like Prometheus and Loki.

|
By Ankit Anand
Welcome to the 35th edition of our monthly product newsletter - SigNal 35! We have made significant advancements in enhancing our product. The integration feature we shipped will enable quick-start monitoring for popular technologies in SigNoz. Let’s see what humans of SigNoz were up to in the month of March 2024.

|
By Harish R
According to Akamai, 83% of web traffic is through APIs. Microservices, servers, and clients constantly communicate to exchange information. Even the Google search you made to reach this article involved your browser client calling Google APIs. Given APIs govern the internet, businesses rely on them heavily. API health is directly proportional to business prosperity. This article covers everything about API monitoring, so your API infrastructure’s health is always in check ✅.

|
By SigNoz
Monitoring website performance and error tracking is critical for a great customer experience. In our Launch Week recently, we demo'ed how you can monitor core web vitals and monitor frontend errors in SigNoz. Here's a short demo on the same.

|
By SigNoz
Talk by Pranay on Scaling OpenTelemetry collectors with Kafka by Pranay in Conf42 SRE summit in 2024. Pranay talks about challenges with scaling Otel collectors and how Kafka can help solve it. He also shares how they use this architecture at SigNoz to scale their cloud service.

|
By SigNoz
More about SigNoz: SigNoz - Monitor your applications and troubleshoot problems in your deployed applications, an open-source alternative to DataDog, New Relic, etc. Backed by Y Combinator. SigNoz helps developers monitor applications and troubleshoot problems in their deployed applications. SigNoz uses distributed tracing to gain visibility into your software stack.

|
By SigNoz
Welcome to last day of SigNoz Launch Week! We will start with a chat with Ankit (CTO, SigNoz) about the evolution of SigNoz, our focus on OpenTelemetry and belief in open-source. Post that we will deep dive into recently released Access Token management feature which will help users programmatically access data stored in SigNoz and unlock powerful use cases. Then we will showcase our new SaaS onboarding flow which makes getting started with SigNoz much easier. We will also discuss the process we follow for improving our documentation & onboarding flow.

|
By SigNoz
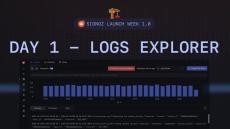
For day 4, we will showcase the recent work we have done in Logs Pipeline. With Log Pipelines, you can transform logs to suit your querying and aggregation needs before they get stored in the database. Pipelines provide a way to modify the structure and content of log data without needing to change application code or redeploy components. By extracting relevant attributes from logs, pipelines enable more efficient analysis.

|
By SigNoz
Welcome to SigNoz Launch week! In day 3 we will focus on monitoring frontend with SigNoz. We will take examples on how to monitor web vitals of your application and monitoring errors in client applications. This will be followed by a discussion with our maintainers on nuances of building performant frontend application for data dense products like SigNoz. Do tune in!

|
By SigNoz
For day 2, the features in spotlight are the major improvements we have made in the Metrics module & Query Builder.
|
By SigNoz
Welcome to SigNoz Launch Week 1.0! This is our first launch week, and we’re excited to introduce you to some cool new features in SigNoz. We ship fast but often miss sharing the story behind these features with our community. Launch week for us is an opportunity to share the behind-the-scenes of new features that we have built in the recent past. Our open-source maintainers will share the story on the whats, whys, and hows of new upgrades to SigNoz!
|
By SigNoz
In this video, you will see a demo of how to monitor Kafka with OpenTelemetry. We will instrument a NodeJS application using Kafka and get client side metrics like delay between producer emitting a message to consumer receiving it via distributed tracing. We will also get Kafka server metrics like consumer lag and plot it dashboards.

|
By SigNoz
In this livestream, we will walk through a demo of how to get client side insights from Kafka using distributed tracing. We will take a NodeJS producer and consumer setup communicating via Kafka to show how one can instrument this with OpenTelemetry, and get metrics from a client perspective. We will also touch on getting Kafka metrics using OpenTelemetry receivers.
- May 2024 (10)
- April 2024 (2)
- March 2024 (5)
- February 2024 (25)
- January 2024 (29)
- December 2023 (13)
- November 2023 (15)
- October 2023 (22)
- September 2023 (11)
- August 2023 (21)
- July 2023 (7)
- June 2023 (14)
- May 2023 (4)
- April 2023 (6)
- March 2023 (7)
- February 2023 (11)
- January 2023 (8)
- December 2022 (14)
- November 2022 (3)
- October 2022 (2)
- September 2022 (8)
- August 2022 (7)
- July 2022 (13)
- June 2022 (21)
- May 2022 (8)
- April 2022 (5)
- March 2022 (7)
- February 2022 (3)
- January 2022 (1)
- December 2021 (1)
- November 2021 (3)
- October 2021 (3)
- September 2021 (11)
- August 2021 (6)
- July 2021 (4)
- June 2021 (2)
- May 2021 (2)
- April 2021 (2)
- February 2021 (2)
- November 2020 (1)
- July 2020 (1)
- May 2020 (1)
- January 2020 (1)
- November 2019 (4)
- September 2019 (1)
- August 2019 (2)
Open-source Observability platform. Understand issues in your deployed applications & solve them quickly.
Why SigNoz?
- Your data in your boundary: No need to worry about GDPR and other data protection laws. All your tracing and monitoring data is now in YOUR infra.
- Forget HUGE SaaS bills: No abrupt pricing changes. No unexpected month-end bills. Get transparent usage data.
- Take Control: No abrupt pricing changes. No need to spend weeks in vendor slack for that one small feature. Extend SigNoz to suit your needs.
Single pane for complete metrics and traces, no need to shift to different systems.