Operations | Monitoring | ITSM | DevOps | Cloud
May 2021
Lightrun Secures $23 Million in Series A Funding to Shift Observability "Left"
Giving Security a Seat at the Table with Full-Stack Observability
Protect your end user with a modern approach to application security. Learn how an observability platform can help unite IT teams.
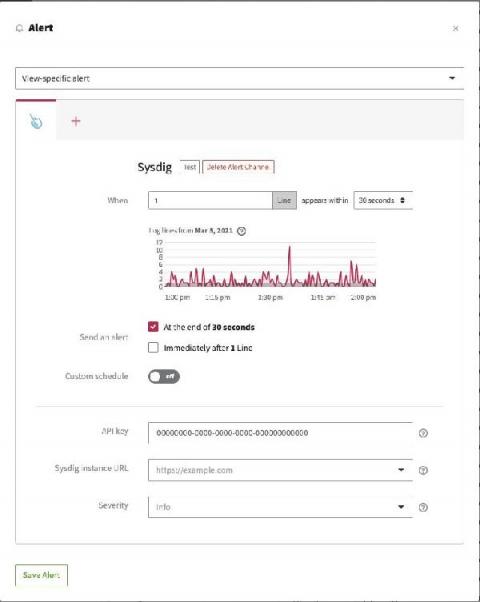
See your logs and metrics together with LogDNA and Sysdig integration
Observability is the key to solving problems quickly, and organizations use many tools to try to increase visibility in their environments so they don’t miss anything. Typical sources of observability include metrics, logs, and traces. The foundation of monitoring, metrics are predictable counts or measurements that are aggregated over a specific period of time. Timestamped records of discrete events that can store outputs from applications, systems, and services.
2 Ways to Integrate the Jaeger App with VMware Tanzu Observability Without Code Changes
In microservices architecture, to identify performance issues—including latency—it’s important to monitor each service and all inter-service communication. Jaeger and VMware Tanzu Observability can help. Jaeger is an open source, distributed tracing system released by Uber Technologies. VMware Tanzu Observability is a high-performance streaming analytics platform that supports 3D observability (e.g., metrics, histograms, and traces/spans).
The Hidden Cost of Sampling in Observability
Today’s software is incredibly complicated and creates tons of data. Metrics, logs, and traces are generated constantly by hundreds of services for even simple applications. Every transaction can generate on the order of kilobytes of metadata about the transaction — and multiplying that to account for even a small amount of concurrency can create a few megabytes a second (or ~300GB/day) of data that needs to be captured and analyzed for later use.
Observability: It's the User Experience, Stupid!
Observability, which originated from control theory, measures how well you can understand a system’s internal states from its external outputs. Observability uses instrumentation to provide insights that aid monitoring. In DevOps, gaining observability is achieved through a set of monitoring solutions. The shift to use one vendor platform to do so, versus multiple solutions, make sense as.
Cloud Observability 101: Start and End with Performance
ServiceNow acquires next-gen observability leader Lightstep
I’m excited to announce that ServiceNow has signed an agreement to acquire next-generation observability leader Lightstep. Combining Lightstep’s innovative observability capabilities with ServiceNow’s unmatched Now Platform will help customers better manage software complexity, reliability, and performance while enabling the enterprise workflows that deliver great experiences.
How Cool? Very Cool! Lightrun named a Cool Vendor by Gartner in Monitoring, Observability, and Cloud Operations
We are thrilled to announce that Lightrun — the world’s first dev-native continuous observability and debugging platform — has been recognized by Gartner as a Cool Vendor, based on its April 28 report titled, “Cool Vendors in Monitoring, Observability and Cloud Operations” by Padraig Byrne, Pankaj Prasad, Hassan Ennaciri, Venkat Rayapudi, and Gregg Siegfried. “Lightrun helps reduce mean time to repair (MTTR) by enabling continuous debugging capabilities.
Adding free and open Elastic APM as part of your Elastic Observability deployment
In a recent post we showed you how to get started with the free and open tier of Elastic Observability. Today we'll walk through what you need to do to expand your deployment so you can start gathering metrics from application performance monitoring (APM), or "tracing" data in your observability cluster, for free.
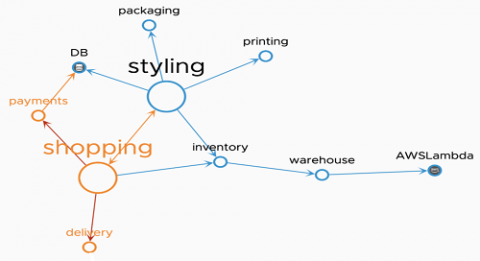
Dynamic Service Graph | Tigera - Long
Application Layer Observability | Tigera - Long
Splunk Observability Cloud: Cutting through the complexity of modern applications
Watch Splunk's Observability Cloud Demo
Observability: It's Not What You Think
Observability is a mindset that enables you to answer any question about your entire business through collection and analysis of data.


