Operations | Monitoring | ITSM | DevOps | Cloud

Latest Posts

5 Top Kubernetes Observability Challenges and Solutions

Observability in IT refers to the ability to measure a system's internal functioning by studying its signals from the outside. Modern IT observability is achieved through three kinds of telemetry: metrics, traces, and logs. Metrics aggregate events to gauge a system’s current state. Tracing tracks the progress of each transaction to not only measure performance but also debug the problem. On the other hand, logs record each event, which can help during troubleshooting.

Enrich your IT ecosystem with data-driven insights from integrations with Site24x7 observability

In today's digital world, websites and applications are the lifeblood of your business. But ensuring their performance and uptime in a complex IT landscape, with its mix of technologies and systems, is a constant challenge. Imagine a sale overwhelming your online store, causing the website to slow down and frustrated customers to abandon carts. Downtime like this isn't just lost sales; it damages your reputation and hinders innovation as IT teams scramble to fix issues instead of building new features.

LAMA Reporting: How can Site24x7 save the day?

When the National Stock Exchange of India (NSE) deliberated on an approach to making cloud computing accessible and compliant to handle brokerage systems, the questions that needed immediate attention were:- How to handle technical glitches during peak trading hours?- What would it take for stock brokers to use cloud computing to navigate the intricate world of trade and investment without revenue loss?

From chaos to clarity: Using NetFlow analysis for efficient network management

Analyzing network traffic data can quickly descend into chaos due to the increasing number of devices and applications in organizations, making it difficult to untangle the complexity manually. Many organizations now use network traffic analyzers to streamline this process. But what exactly is a network traffic analyzer, and how can it help with effective network management? Let's explore this in detail.

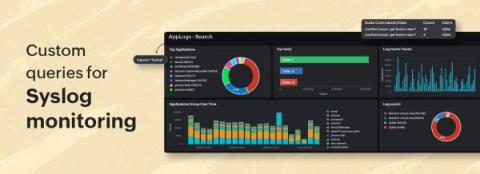
Log-based search and alert queries for syslog monitoring

Syslog entries offer crucial information about the health and status of various components within a system or network. Administrators can utilize syslog data to monitor system activities, identify anomalies, and take proactive measures to ensure system stability and security. In this blog, we'll share a few useful queries for monitoring syslog using Site24x7's log management features. These queries are meant to improve network visibility and simplify troubleshooting.

Why the internet is unreliable and how can you track ISP bottlenecks

The internet serves as the backbone for communication, collaboration, and access to information in today’s digital world. However, despite its widespread use and importance, the internet is not immune to reliability issues. From occasional slowdowns to complete outages, internet users often encounter disruptions that can impact their productivity and connectivity. Several factors contribute to internet unreliability.

Boost application speed by monitoring key Redis cache metrics

With users today expecting speed, reliability, and responsiveness from every application they use, the delivery of seamless experiences across various platforms becomes essential for organizations. Caching solutions like Redis play a vital role in these ecosystems by storing frequently accessed data in memory, reducing the need to retrieve it from slower back-end systems, such as databases.

Top 3 reasons why you need to use Site24x7's thread dump analyzer tool

Imagine having x-ray vision for your application and seeing exactly what's happening under the hood in real time. That's what thread dumps do for your application—they are a vital component of application performance monitoring (APM) and give you a super-powered peek into its inner workings, helping you spot issues and fix them faster than you can imagine.

Deliver efficient communication through incident templates

Imagine this scenario: Imagine this scenario: You are a user of an online service, and suddenly you encounter a technical glitch. You head to the status page for updates, expecting clear information about the issue. However, you are met with vague or unstructured updates, leaving you uncertain about the severity and resolution timeline of the problem.