

|
By Benjamin Pitts
Using Apache Zipkin is important because it provides detailed, end-to-end tracing of requests across distributed systems, helping to identify latency issues and performance bottlenecks. Monitoring your Zipkin environment is crucial to ensure the reliability and performance of your tracing system, allowing you to quickly detect and address any anomalies or downtime.

|
By Benjamin Pitts
Apache Tomcat servers are useful because they provide a robust and flexible environment for running Java-based web applications, ensuring high performance and scalability. They are essential to monitor because regular monitoring helps in identifying performance bottlenecks, security vulnerabilities, and potential failures, ensuring the reliability and efficiency of web applications.

|
By Benjamin Pitts
Monitoring Apache HTTP servers is crucial for ensuring they are always available and perform optimally, helping to identify and resolve bottlenecks and inefficiencies. It aids in capacity planning and security by detecting abnormal activities and potential security threats. Regular monitoring also facilitates troubleshooting, improves service reliability, and ensures compliance with regulatory standards.

|
By Elliot Langston
There is a greater need than ever to ensure seamless web application performance. One of the foundational components ensuring this smooth operation is load balancing. While the term might sound technical, its concept is simple and vital for maintaining an uninterrupted online user experience. This article will explore load balancing's various algorithms and types and their significance in modern web infrastructure.

|
By Elliot Langston
When businesses experience a surge in activity, there's the potential for unforeseen infrastructure issues. This underscores the importance of establishing infrastructure alerts well in advance. We recognize the paramountcy of a smooth operational period for your business. In this article, we'll delve into the pivotal role of alerts in ensuring the resilience of your infrastructure and the satisfaction of your customers during high-demand periods.

|
By Elliot Langston
In today’s quickly evolving technological landscape, virtualization has become increasingly important—it maximizes the use of hardware resources, enhances the IT infrastructure’s overall efficiency, and streamlines operations.

|
By Benjamin Pitts
Monitoring SNMP (Simple Network Management Protocol) devices is crucial for maintaining network health and security, enabling early detection of issues and proactive troubleshooting. Continuous monitoring ensures efficient resource utilization, minimizes downtime, and enhances overall network performance. In this article, we'll detail how to use the Telegraf agent to collect SNMP (MIB) performance statistics that you can forward to a data source.

|
By Benjamin Pitts
It's important to monitor uWSGI instances to ensure their stability, performance, and availability, helping to identify and address issues promptly before they affect the overall application performance. Monitoring uWSGI instances also provides insights into resource utilization, request throughput, and potential bottlenecks, enabling proactive optimization and efficient scaling of the application infrastructure.

|
By Benjamin Pitts
Monitoring your ClickHouse database is a proactive measure that helps maintain its health and ensure that it continues to meet the needs of your applications and users efficiently. It allows you to address issues before they become critical, ensuring that your database environment is secure, reliable, and performing optimally. In this article, we'll detail how to use the Telegraf agent to collect performance metrics from your ClickHouse clusters, and forward them to a datasource.

|
By Elliot Langston
Hosted Graphite is a time-series metrics monitoring tool used for application, systems, infrastructure and network monitoring. HostedGraphite is a Hosted Graphite service that offers the full capabilities and benefits of Graphite, without any of the hassle of trying to set up your own open-source Graphite installation.

|
By MetricFire
This tutorial will show you the steps to successfully send your metrics using our HostedGraphite. We talk about all types of protocols supported, manipulating the metrics sent in graphs, types of metrics, and much more.

|
By MetricFire
Learn how to install and use MetricFire Telegraf in this tutorial. Telegraf is a collector agent for metrics and events from systems. Telegraf allows you to collect metrics from multiple systems and visualize the data in various ways. This Telegraf tutorial will walk you through the installation process and show you how to use the tool to collect metrics and events from systems. This is a great way to monitor your systems and track the performance of your applications in real time.

|
By MetricFire
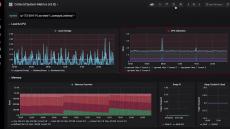
In this video, we explore MetricFire’s powerful dashboarding platform. Discover how to customize your dashboard to view the metrics that matter most to your business. With a variety of visualization options and an intuitive interface, creating and editing charts, tables, and graphs has never been easier. Share your dashboard with your team and keep everyone on the same page. Join MetricFire and start tracking your business metrics today.

|
By MetricFire
Learn more about the functionalities of MetricFire's Hosted Graphite service. Including dashboards, alerting, add-ons, team features and more. MetricFire has everything you could need for a complete monitoring solution.

|
By MetricFire
MetricFire provides powerful monitoring at any scale. Measure, analyze and visualize large amounts of data about your applications and back-end systems without any of the hassles of setting up your own server, or worrying about scaling, backups or maintenance.


- May 2024 (6)
- April 2024 (1)
- March 2024 (8)
- February 2024 (3)
- January 2024 (6)
- December 2023 (9)
- November 2023 (10)
- October 2023 (17)
- September 2023 (28)
- August 2023 (22)
- July 2023 (28)
- June 2023 (23)
- May 2023 (11)
- April 2023 (11)
- March 2023 (4)
- February 2023 (3)
- January 2023 (3)
- December 2022 (3)
- November 2022 (31)
- October 2022 (6)
- September 2022 (2)
- July 2022 (4)
- June 2022 (2)
- May 2022 (2)
- April 2022 (1)
- March 2022 (3)
- February 2022 (2)
- December 2021 (2)
- November 2021 (1)
- October 2021 (2)
- September 2021 (5)
- July 2021 (1)
- June 2021 (2)
- May 2021 (4)
- April 2021 (3)
- March 2021 (15)
- February 2021 (5)
- January 2021 (6)
- December 2020 (2)
- November 2020 (6)
- October 2020 (18)
- September 2020 (4)
- August 2020 (5)
- June 2020 (3)
- April 2020 (3)
- March 2020 (2)
- June 2019 (1)
MetricFire provides a complete infrastructure and application monitoring platform from a suite of open source monitoring tools. Depending on your setup, choose Hosted Prometheus or Graphite and view your metrics on beautiful Grafana dashboards in real-time.
Understand your data at a glance with our simple, flexible, and affordable monitoring platform:
- Graphite. Supercharged. We took the good parts of open-source Graphite and added everything it's missing: a built in agent, team accounts, granular dashboard permissions, and integrations to other technologies and services like AWS, Heroku, logging tools and more.
- Powerful, scalable, Prometheus monitoring. We offer Prometheus as-a-service, with all the capabilities missing from vanilla Prometheus – Grafana dashboards, long-term storage, and deeply technical support when you need it.
- View your monitoring data on beautiful Grafana dashboards – in real time. Get a deeper understanding of your data on a slick, feature-rich graph and dashboard editor.
Hosted Graphite and Prometheus with Grafana Dashboards.