|
By Shah Ahmed
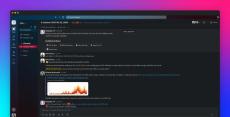
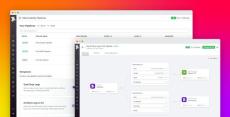
Modern, distributed application architectures pose particular challenges when it comes to coordinating incident management. DevOps, SREs, and security teams—often spread out across separate locations and time zones, and equipped with limited knowledge of each other’s services—must work quickly to collaboratively triage, troubleshoot, and mitigate customer impact.
|
By Zara Boddula
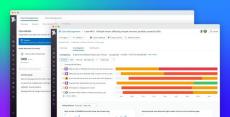
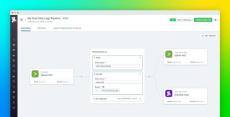
Maintaining service availability is a challenge in today’s complex cloud environments. When a critical incident arises, the underlying cause can be buried in a sea of alerts from interconnected services and applications. Central operations teams often face an overload of disparate alerts, causing confusion, delayed incident response, alert fatigue, and redundant resolution efforts. These issues can negatively impact revenue and customer experience, especially during an outage.
|
By Ivan Ilichev
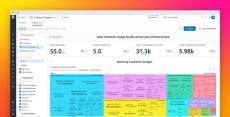
Datadog’s Container Images view provides key insights into every container image used in your environment, helping you quickly detect and remediate security and performance problems that can affect multiple containers in your distributed system. In addition to having a snapshot of the performance of your container fleet, it’s also critical to understand large-scale trends in security posture and resource utilization over time.
|
By Jordan Obey
Machine learning (ML) platforms such as Amazon Sagemaker, Azure Machine Learning, and Google Vertex AI are fully managed services that enable data scientists and engineers to easily build, train, and deploy ML models. Common use cases for ML platforms include natural language processing (NLP) models for text analysis and chatbots, personalized recommendation systems for e-commerce web applications and streaming services, and predictive business analytics.
|
By Thomas Sobolik
Regardless of how much effort teams put into developing, training, and evaluating ML models before they deploy, their functionality inevitably degrades over time due to several factors. Unlike with conventional applications, even subtle trends in the production environment a model operates in can radically alter its behavior. This is especially true of more advanced models that use deep learning and other non-deterministic techniques.
|
By Nicholas Thomson
Datadog’s infrastructure comprises hundreds of distributed services, which are constantly discovering other services to network with, exchanging data, streaming events, triggering actions, coordinating distributed transactions involving multiple services, and more. Implementing a networking solution for such a large, complex application comes with its own set of challenges, including scalability, load balancing, fault tolerance, compatibility, and latency.
|
By Candace Shamieh
Private Service Connect (PSC) is a Google Cloud networking product that enables you to access Google Cloud services, third-party partner services, and company-owned applications directly from your Virtual Private Cloud (VPC). PSC helps your network traffic remain secure by keeping it entirely within the Google Cloud network, allowing you to avoid public data transfer and save on egress costs. With PSC, producers can host services in their own VPCs and offer a private connection to their customers.
|
By Kaushik Akula
Modern organizations face a challenge in handling the massive volumes of log data—often scaling to terabytes—that they generate across their environments every day. Teams rely on this data to help them identify, diagnose, and resolve issues more quickly, but how and where should they store logs to best suit this purpose? For many organizations, the immediate answer is to consolidate all logs remotely in higher-cost indexed storage to ready them for searching and analysis.
|
By Candace Shamieh
The volume of logs generated from modern environments can overwhelm teams, making it difficult to manage, process, and derive measurable value from them. As organizations seek to manage this influx of data with log management systems, SIEM providers, or storage solutions, they can inadvertently become locked into vendor ecosystems, face substantial network costs and processing fees, and run the risk of sensitive data leakage.
|
By Kaushik Akula
Organizations often adjust their logging strategy to meet their changing observability needs for use cases such as security, auditing, log management, and long-term storage. This process involves trialing and eventually migrating to new solutions without disrupting existing workflows. However, configuring and maintaining multiple log pipelines can be complex. Enabling new solutions across your infrastructure and migrating everyone to a shared platform requires significant time and engineering effort.
|
By Datadog
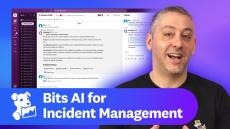
Datadog is constantly elevating the approach to cloud monitoring and security. This Month in Datadog updates you on our newest product features, announcements, resources, and events. To learn more about Datadog and start a free 14-day trial, visit Cloud Monitoring as a Service | Datadog. This month, we put the Spotlight on Bits AI for Incident Management.
|
By Datadog
Monitoring backend signals has been standard practice for years, and tech companies have been alerting their SRE and software engineers when API endpoints are failing. But when you’re alerted about a backend issue, it’s often your end users who are directly affected. Shouldn’t we observe and alert on this user experience issues early on? As frontend monitoring is a newer practice, companies often struggle to identify signals that can help them pinpoint user frustrations or performance problems.
|
By Datadog
In 2018 Datadog released Watchdog to proactively detect anomalies on your observability data. But what defines an anomaly? How do you avoid false positives? At Datadog Summit London 2024, Nils Bunge, product manager at Datadog, shared the story of the creation of the first Datadog AI feature (Watchdog Alert), what we learned from it and how we applied those lessons to all the added AI functionalities across the years.
|
By Datadog
On This Month in Datadog, we’re covering Datadog Security for Google Cloud, our integration with NVIDIA Triton Inference Server, and Sankey visualizations, which offer overviews of common paths users take across your app.
|
By Datadog
There are many different ways to implement Site Reliability Engineering (SRE). From team structures to roles and responsibilities to planning and prioritization flows, there’s no golden path for how to organize things. As Datadog has shifted from a startup to a quickly-growing public company, we’ve seen our own SRE practice evolve. With over 22,000 customers sending trillions of data points each day, keeping Datadog reliable is critical to our business.
|
By Datadog
In this episode we'll visit the world of predictive analytics and machine learning and uncover how these cutting-edge technologies are transforming the way Datadog monitors and improves its services. We’ll focus our conversation on two key aspects: using advanced statistical methods for proactive monitoring and the strategic implementation of machine learning for algorithm enhancement.
|
By Datadog
Datadog is an observability and security platform that ingests and processes tens of trillions of data points per day, coming from more than 22,000 customers. Processing that amount of data in a reasonable time stretches the limits of well known data engines like Apache Spark. In addition to scale, Datadog infrastructure is multi-cloud on Kubernetes and the data engineering platform is used by different engineering teams, so having a good set of abstractions to make running Spark jobs easier is critical.
|
By Datadog
Learn how Complyt is using Datadog Application Performance Monitoring (APM) and distributed tracing to turn data into knowledge and reduce application response times by more than 80%, which enabled them to meet SLAs for their largest customers.
|
By Datadog
What’s new at Datadog? An advanced feature to search and filter traces; measuring users who regularly engage with your app over time; and a centralized system for tracking, triaging, and addressing security issues.
|
By Datadog
As Docker adoption continues to rise, many organizations have turned to orchestration platforms like ECS and Kubernetes to manage large numbers of ephemeral containers. Thousands of companies use Datadog to monitor millions of containers, which enables us to identify trends in real-world orchestration usage. We're excited to share 8 key findings of our research.
|
By Datadog
The elasticity and nearly infinite scalability of the cloud have transformed IT infrastructure. Modern infrastructure is now made up of constantly changing, often short-lived VMs or containers. This has elevated the need for new methods and new tools for monitoring. In this eBook, we outline an effective framework for monitoring modern infrastructure and applications, however large or dynamic they may be.
|
By Datadog
Where does Docker adoption currently stand and how has it changed? With thousands of companies using Datadog to track their infrastructure, we can see software trends emerging in real time. We're excited to share what we can see about true Docker adoption.
|
By Datadog
Build an effective framework for monitoring AWS infrastructure and applications, however large or dynamic they may be. The elasticity and nearly infinite scalability of the AWS cloud have transformed IT infrastructure. Modern infrastructure is now made up of constantly changing, often short-lived components. This has elevated the need for new methods and new tools for monitoring.
|
By Datadog
Like a car, Elasticsearch was designed to allow you to get up and running quickly, without having to understand all of its inner workings. However, it's only a matter of time before you run into engine trouble here or there. This guide explains how to address five common Elasticsearch challenges.
|
By Datadog
Monitoring Kubernetes requires you to rethink your monitoring strategies, especially if you are used to monitoring traditional hosts such as VMs or physical machines. This guide prepares you to effectively approach Kubernetes monitoring in light of its significant operational differences.
- May 2024 (3)
- April 2024 (19)
- March 2024 (11)
- February 2024 (21)
- January 2024 (19)
- December 2023 (18)
- November 2023 (23)
- October 2023 (15)
- September 2023 (14)
- August 2023 (28)
- July 2023 (15)
- June 2023 (17)
- May 2023 (22)
- April 2023 (13)
- March 2023 (22)
- February 2023 (12)
- January 2023 (8)
- December 2022 (9)
- November 2022 (27)
- October 2022 (22)
- September 2022 (14)
- August 2022 (21)
- July 2022 (13)
- June 2022 (13)
- May 2022 (18)
- April 2022 (14)
- March 2022 (6)
- February 2022 (14)
- January 2022 (17)
- December 2021 (9)
- November 2021 (16)
- October 2021 (26)
- September 2021 (8)
- August 2021 (18)
- July 2021 (15)
- June 2021 (16)
- May 2021 (23)
- April 2021 (20)
- March 2021 (16)
- February 2021 (9)
- January 2021 (10)
- December 2020 (22)
- November 2020 (17)
- October 2020 (12)
- September 2020 (15)
- August 2020 (22)
- July 2020 (20)
- June 2020 (16)
- May 2020 (18)
- April 2020 (24)
- March 2020 (13)
- February 2020 (13)
- January 2020 (11)
- December 2019 (16)
- November 2019 (11)
- October 2019 (11)
- September 2019 (12)
- August 2019 (16)
- July 2019 (18)
- June 2019 (11)
- May 2019 (12)
- April 2019 (20)
- March 2019 (10)
- February 2019 (9)
- January 2019 (6)
- December 2018 (7)
- November 2018 (7)
- October 2018 (13)
- September 2018 (5)
- August 2018 (12)
- July 2018 (12)
- June 2018 (6)
- March 2018 (1)
- December 2017 (1)
- November 2017 (1)
Datadog is the essential monitoring platform for cloud applications. We bring together data from servers, containers, databases, and third-party services to make your stack entirely observable. These capabilities help DevOps teams avoid downtime, resolve performance issues, and ensure customers are getting the best user experience.
See it all in one place:
- See across systems, apps, and services: With turn-key integrations, Datadog seamlessly aggregates metrics and events across the full devops stack.
- Get full visibility into modern applications: Monitor, troubleshoot, and optimize application performance.
- Analyze and explore log data in context: Quickly search, filter, and analyze your logs for troubleshooting and open-ended exploration of your data.
- Build real-time interactive dashboards: More than summary dashboards, Datadog offers all high-resolution metrics and events for manipulation and graphing.
- Get alerted on critical issues: Datadog notifies you of performance problems, whether they affect a single host or a massive cluster.
Modern monitoring & analytics. See inside any stack, any app, at any scale, anywhere.


