Operations | Monitoring | ITSM | DevOps | Cloud

RUM

Ensure release safety with feature flag tracking in Datadog RUM

Developers and teams who want to deploy new code often and safely leverage feature flags to decouple code deployments from feature releases. Feature flags enable teams to release new features to a subset of users, making it possible to test a new feature’s impact on users and ensuring that developers can easily roll back the feature if it causes downstream issues.

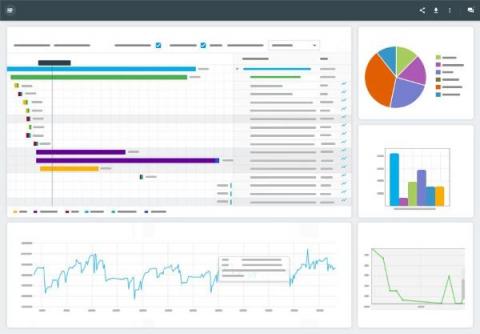
4 Differences Between DEM & RUM You Should Know

If you want to deliver an outstanding user experience you must know the differences between DEM and RUM. In this modern world, businesses are embracing digitization to provide better services to their customers. However, customer expectations and preferences have changed drastically over time. To address customer demands, businesses have started investing in systems and applications that enhance the user experience.

Real user monitoring with Applications Manager

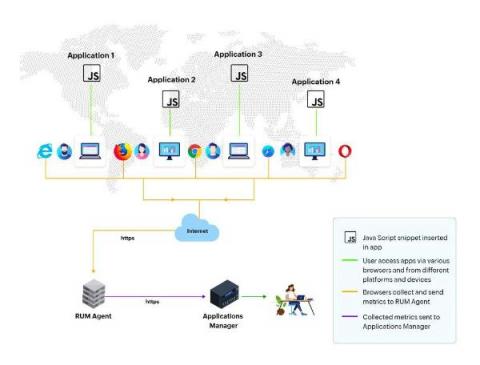
Real user monitoring (RUM) is used to collect and analyze data about user interactions with a website or application in real-time. This enables organizations to gain valuable insights into the performance and user experience of their digital products. Despite its importance, the significance of RUM is often overlooked, and many organizations fail to leverage its benefits. By employing a RUM tool such as Applications Manager (APM), you can stay vigilant by capturing real-time user interactions.

Real User Monitoring (RUM) vs. Synthetic Monitoring

Real User Monitoring (RAM) and Synthetic Monitoring are two different approaches to website and application monitoring. They both serve the same purpose of ensuring optimal performance of a website or application, but they differ in how they collect data and the types of insights they provide. Understanding the difference between the two can help you determine which approach is best suited for your specific needs.

Network Path Monitoring Pinpoints and Mitigates Connection Bottlenecks

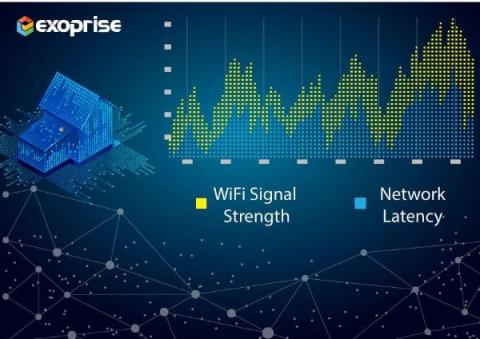
An employee calls complaining about slow response time. Another one has similar trouble. No red lights are flashing on the Network Operations console, so the network is up and running. What is happening? Frankly, it could be just about anything: an overworked router, a runaway process on a laptop, a slow loading web page, or a bandwidth hog at home.

Why Seven.One Entertainment Group Chose Datadog RUM for Client-side Observability

Hear why Seven.One Entertainment Group, a subsidiary of ProSiebenSat.1 Media SE , which is Germany’s top commercial broadcaster, chose Datadog Real User Monitoring and how the solution enabled them to better understand client-side issues.

Troubleshoot faulty frontend deployments with Deployment Tracking in RUM

Many developers and product teams are iterating faster and deploying more frequently to meet user expectations for responsive and optimized apps. These constant deployments—which can number in the dozens or even hundreds per day for larger organizations—are essential for keeping your customer base engaged and delighted. However, they also make it harder to pinpoint the exact deployment that led to a rise in errors, a new error, or a performance regression in your app.

General availability of Flutter Agent for Mobile Real User Monitoring

Cisco AppDynamics Flutter Agent for MRUM is a powerful tool that provides comprehensive performance monitoring for mobile applications. As a mobile app developer, staying on top of the latest technologies and tools is essential to building high-performing, user-friendly apps that keep customers engaged and coming back for more. One of the most popular mobile development frameworks on the market today is Flutter, a free and open source framework created by Google.

Correlate Datadog RUM events with traces from OTel-instrumented applications

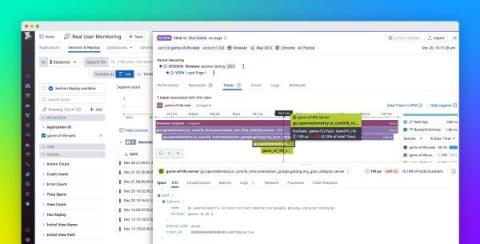
OpenTelemetry (OTel) is an open source, vendor-neutral observability framework that supplies APIs, SDKs, and tools for the instrumentation of cloud-native applications and services. OTel enables you to collect metrics, logs, and traces from a variety of sources and route them to various backends. By itself, however, it can’t help you analyze this data or correlate telemetry from different parts of your stack.