Operations | Monitoring | ITSM | DevOps | Cloud

July 2023

ServiceNow named a Leader in process-centric AIOps platforms

I’m excited to announce The Forrester Wave™: Process-Centric AI For IT Operations (AIOps), Q2 2023 named ServiceNow as a Leader among the top vendors in the crowded AIOps market.1 Our journey to this position underscores our leadership in predictive AIOps. We’ve continuously harnessed the immense potential of AI to enhance operational efficiencies, drive productivity, and revolutionize user experiences.

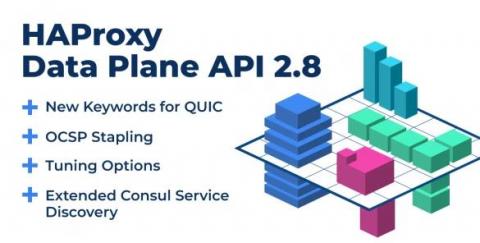
Announcing HAProxy Data Plane API 2.8

We are proud to announce that we have released HAProxy Data Plane API 2.8, available on our GitHub page. This release follows the recent HAProxy 2.8 release and incorporates its changes, along with some improvements and changes specific to the API. HAProxy Data Plane API 2.8 adds new keywords focused on QUIC, OCSP stapling, and tuning options that allow you to customize your HAProxy process using the HTTP REST API programmatically.

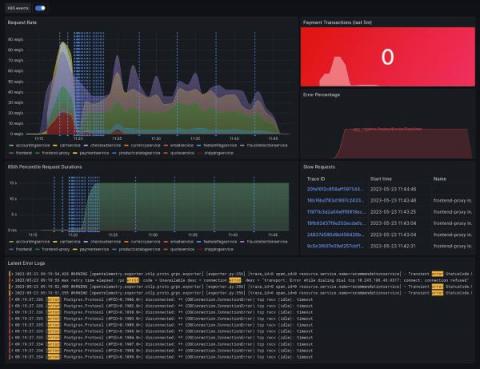
How to fix performance issues using k6 and the Grafana LGTM Stack

The Grafana Labs ecosystem is built on a range of different projects that incorporate logs, metrics, traces across load testing, and Kubernetes monitoring. I’ll assume you know all of that data (and more!) can be visualized in Grafana. What made my observability dream become reality, though, is how these systems can work together to help you effectively debug performance issues and operate your system with more confidence.

How to run faster Loki metric queries with more accurate results

Today I want to talk about metric queries. More specifically, I want to talk about an important concept that is going to make your queries run faster, give you more accurate results, and make your Grafana Loki operators (like me) much happier. A metric query in Loki looks like this: And the part I want to talk about is that at the end. Now, if you’re like me and have a short attention span and are already bored — I understand.

Troubleshooting Bad Health Checks on Amazon ECS

Health checks are an important factor when working with containerized applications in the cloud and are the source of truth for many applications in terms of their running status. In the context of AWS Elastic Container Service (ECS), health checks are a periodic probe to assess the functioning of containers. In this blog, we will explore how Lumigo, a troubleshooting platform built for microservices, can help provide insights into container crashes and failed health checks.

How to maximize utilization of AWS spot instances with Elastigroup

The AWS spot instances marketplace provides many options to generate savings. AWS’s cloud ecosystem offers several different instance types, zones, and architectures to support almost any application demand. The abundance of options can overwhelm even experienced cloud professionals and may prevent the organization from fully reaping the benefits of working with spot instances.

Save 96% on Data Storage Costs

Users with real-time and other analytic workloads want or need to keep large volumes of historical data to aid in important activities, such as ad hoc historical trend analysis and training AI models. However, storing this much data in a way that also makes it easily queryable becomes prohibitively expensive. As a result, users must balance data availability and usability with sacrificing data fidelity and storage costs. That is until now.