Operations | Monitoring | ITSM | DevOps | Cloud

July 2023

10 Steps to Create a Risk Management Plan

It’s always nice to know the theory behind the practice, but sadly that’s not enough. A Risk Management plan is what will make you truly effective at avoiding risks and keeping your organization safe. Having a set of guidelines will help you map your activities, ensure the right people are held accountable, and avoid possible disruptions or fines. Don’t know where to start? Don’t worry!

Charmed Spark beta release is out - try it today

The Canonical Data Fabric team is pleased to announce the first beta release of Charmed Spark, our solution for Apache Spark. Apache Spark is a free, open source software framework for developing distributed, parallel processing jobs. It’s popular with data engineers and data scientists alike when building data pipelines for both batch and continuous data processing at scale.

Docker Compose Logs: Guide & Best Practices

Docker Compose is a tool for defining and running multi-container Docker applications. It allows developers to streamline the process of configuring, building, and running multiple containers as a single unit with a docker-compose.yml. This configuration file specifies the services, networks, and volumes required for an application, and their relationships and dependencies. The docker-compose logs command displays the logs of all services defined in the docker-compose.yml file.

Redcentric gained flexible monitoring capabilities across multiple cloud environments

Hear Paul Mardling, Chief Technology Officer, and Ed Jackson, OSS Manager, describe Redcentric’s complex hybrid infrastructure and their difficulties with monitoring tool sprawl when their cloud deployments expanded. Redcentric used LogicMonitor to gain flexible monitoring capabilities across multiple cloud environments to keep up with developer needs. Out-of-the-box data sources and fast, agentless monitoring helped them see everything across thousands of devices in their IT estate, with excellent customer support to help at a moment’s notice.

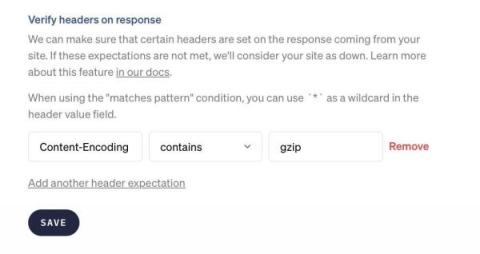
Our uptime check can now verify response headers

When we make a request to your site to verify that your site is up, the response of your server will contain certain headers. We can verify that those headers contain the values you expect. If these expectations are not met, we'll consider your site as down. In the "Responses" section of the uptime settings page, you can specify which headers we should verify. You could add this expectation to ensure your page uses gzip compression.

How to Optimize Your Website for Video

Video content has taken the Internet by storm in recent years. Capturing large volumes of information quickly and engagingly makes videos popular among consumers who often prefer them over text-only media such as blog posts. One survey shows how adding videos into landing pages could boost conversion rates up to 80% while increasing visitor time on your website and potentially opening avenues for sales opportunities.

How Schneider Electric reduced MTTI and alert noise by consolidating monitoring tools

Hear Observability and Monitoring Strategist, Arun Mandayam, describe challenges that Schneider Electric faced around data interpretation and difficulties when using multiple monitoring tools. Arun describes how LogicMonitor helped consolidate monitoring tools, enabled them to onboard new cloud accounts, network devices, and on-prem systems on a unified platform, and helped significantly reduce MTTI and alert noise.