Operations | Monitoring | ITSM | DevOps | Cloud

March 2024

Telegraf Configuration Migration

In v1.30.0, Telegraf will remove a few long-standing deprecated plugins. These plugins have been deprecated for a number of years, and plugins with better support and configuration options now replace them. This version of Telegraf also removes a number of configuration options. The full list of deprecated plugins includes: Starting from v1.30.0 Telegraf will show an error message and stop running if any of the plugins or options are present in your configuration.

More bang for your K8s buck: How automatic rightsizing saves up to 50%

In today’s fast-paced digital landscape, businesses are increasingly relying on Kubernetes (K8s) to efficiently manage their containerized workloads. However, many organizations face a significant challenge when it comes to effectively utilizing compute resources, specifically CPU and memory. One Datadog study found that more than 65% of K8s containers use less than 50% of requested memory and CPU. That’s a staggering waste.

The Recipe for Speeding Troubleshooting in Modern Networks

I love cooking. I find it to be a very creative outlet. I enjoy being able to combine various ingredients, which each add a specific flavor, color, and even texture. When these ingredients come together in a complementary way, it can result in a tasty, satisfying dining experience. If you think about it, network operations troubleshooting is not much different. Isolated data sets from various siloed tool sets are like the separate ingredients in a recipe.

Streaming Telemetry and SNMP Monitoring with Kentik NMS

Packet Pushers host Ethan Banks gets an overview of Kentik's new Network Monitoring System, Kentik NMS, from Chris O'Brien, Sr. Principal Product Manager at Kentik. Chris demonstrates key features including how Kentik NMS allows network engineers to take full advantage of streaming telemetry. Faster access to network device data using streaming telemetry over SNMP, ensures that NetOps professionals don't miss critical events that happen between traditional polling intervals.

AI-Assisted Network Monitoring: Real or Hype?

Networking experts Chris O'Brien and Nina Bargisen join Capacity Media's Jack Allen to explore the evolving role of AI in network monitoring. They delve into historical applications of AI and machine learning in network observability, the integration of large language models for enhanced troubleshooting, and the significance of diverse data sources. The session includes a live demonstration of the AI-assisted query features of Kentik NMS (Network Monitoring System) and highlightings the advantages of streaming telemetry over SNMP. There's also an insightful Q&A session at the end.

How CleverTap Uses Unit Economics To Control Cloud Costs

At CloudZero, we take special pride in helping our customers to optimize their cloud spend. We especially love it when a longtime customer has experienced so much success with our platform that they can’t help but sing their love of unit economics from the rooftops. In this interview, we sat down with Francis Pereira, Vice President of Infrastructure Engineering at CleverTap, to find out how CleverTap has evolved and grown during their years of partnership with CloudZero.

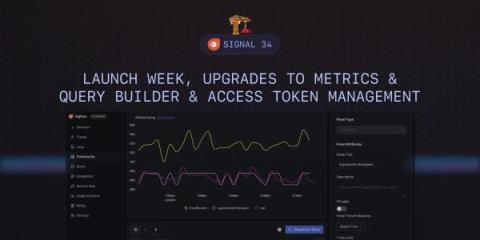
Launch Week, Upgrades to Metrics & Query Builder & Access Token Management - SigNal 34

Welcome to the 34th edition of our monthly product newsletter - SigNal 34! Last month was full of action. We did our first launch week, and we were thrilled to see the response. We have shipped some amazing features recently. Let’s see what humans of SigNoz were up to in the month of February 2024.

8 Kubernetes application performance monitoring challenges and how to solve them

Kubernetes is a widely-adopted platform that manages the containers that host an application. Instead of handling nodes and containers individually, it groups all workloads as orchestrated layers. This abstraction simplifies the overall complexities involved, making the application easier to manage.

SEO monitoring trends to watch in 2024

2023 was a landmark year in SEO, and not for entirely positive reasons. After the emergence of OpenAI and ChatGPT and the realization that AI-powered search was the future focus of major search players like Google and Microsoft, SEO monitoring professionals were rightly thrown into an uncertain landscape. Would traditional search, and all of its standard practices and strategies, disappear within months? What about the ideas of “content is king” and the importance of link-building?

Compare Tests In RapidSpike

Last year we released the “Failure Analysis” dashboard to allow you to compare a failing result with the latest successful one. The feedback was universally positive: users loved being able to compare tests! So we have now released a full comparison tool to allow you to compare any two User Journey or Page Load test results on your website(s). Website test comparison can be useful for analysing and testing website changes.

Grafana vs Splunk - Key Features and Differences

Grafana and Splunk are both used as monitoring tools. But while Grafana is majorly used as a data visualization tool, Splunk is an enterprise security and observability platform. Monitoring tools are essential for any business that wants to have visibility into its IT infrastructure. They provide real-time data that can be used to identify and troubleshoot problems. Grafana and Splunk are two of the most popular monitoring tools on the market. So, which one is better for your business?