Operations | Monitoring | ITSM | DevOps | Cloud

May 2023

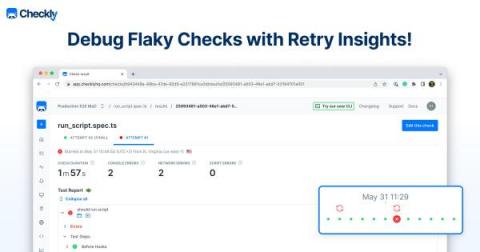
Using Retry Insights to Identify Flaky Checks

As you know, having reliable checks is a cornerstone of synthetic monitoring. We don’t want false alarms, or worse, checks succeeding when things aren’t working. But sometimes, problems can be hard to identify because they only happen intermittently, or in certain situations. Similarly, monitoring results can be skewed by infrastructure issues, or network errors on the monitoring provider end, causing false alarms when there is actually no problem with the product.

Updating Your Tools for API Scopes

The PagerDuty REST API provides 200+ endpoints for users to programmatically access objects and workflows in the PagerDuty platform. Teams leverage these APIs to streamline creating and managing users, teams, services and other components for their environment. Up until now, access to the REST API has been authorized and authenticated via API Keys.

How can companies improve Network and API performance?

In this bi-weekly micro webinar series, Catchpoint and ITOps Times have partnered to explore six critical topics that are essential for ensuring Internet Resilience for your business. Explore each of the topics in the series: In this fourth segment, we’ll discuss techniques for enhancing Network and API performance by implementing Internet Performance Monitoring. Now, let’s get into the episode!

Guide to Azure Blob REST API: Upload, Download, Manage, Secure

Azure Blob Storage is a cloud-based storage solution provided by Microsoft as part of its Azure platform. It enables users to store and manage unstructured data such as text, images, videos, and binary data in the cloud. This makes it a highly scalable and cost-effective way to store large amounts of data without having to worry about hardware maintenance or infrastructure management.

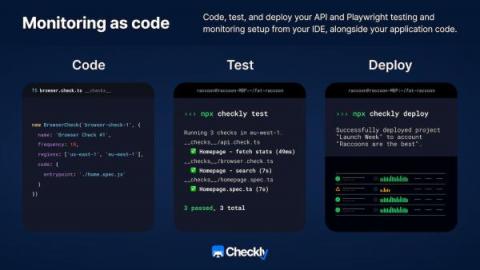
How Monitoring as Code Reduces the Time to Detect and Resolve Issues

A web application or an API breaking is a matter of when, not if. Whether the cause is buggy code making it to production or infrastructure failing to support the software built upon it, incidents of varying severity are the norm rather than the exception, appearing frequently enough that the industry has coined the terms Mean Time To Detect (MTTD) and Mean Time To Recovery (MTTR).

Introducing Checkly's New Look for a New Era

We are thrilled to unveil our new branding and website, reflecting our commitment to providing engineers with the best monitoring as code (MaC) platform for modern software stacks. Our rebranding efforts signify a new era for Checkly and highlight our commitment to continuous innovation and dedication to enabling a MaC workflow for you and your teams.

Checkly Unveils Innovative CLI Uniting Monitoring and Testing Through a Monitoring as Code Workflow

Checkly, the leading provider of monitoring solutions powered by a monitoring as code (MaC) workflow, has announced the general availability of its new, innovative command line interface, the Checkly CLI. This enables a revolutionary workflow that transforms the way testing and monitoring are done, bringing a new level of efficiency and effectiveness to the industry similar to the impact that Infrastructure as code (IaC) had on infrastructure resources.

The Importance of an API Observability Pipeline for SaaS Tools

Third-party APIs and cloud based software as a service (SaaS) tools have become a cornerstone of modern enterprises. It is essential to monitor log data and optimize API performance. This will ensure that development teams provide the desired advantages to clients and users. To address this challenge, businesses can use an observability pipeline. It is a set of tools and processes that monitor and analyze data from various sources. That includes third-party APIs and SaaS tools.

Announcing Checkly CLI GA and Test Sessions Beta

Today the Checkly CLI is generally available. Together with its companion — the new test sessions screen (in beta) — this marks a big milestone for us at Checkly and our users. We already talked about monitoring as code and the CLI during its alpha and beta testing phases but here is a short recap. With the Checkly CLI you have the most powerful monitoring as code workflow at your fingertips.

Checkly CLI is Now GA, and We've Launched Our New Website and Branding

We believe monitoring should be set up as code and live in your repository. Today, we are thrilled to announce that our Checkly CLI is now available to everyone! The CLI is our native tool enabling monitoring as code (MaC). This is a significant achievement for us, and we owe it to our users who beta-tested the CLI and gave us valuable feedback over the past few weeks.

Checkly's New Look for a New Era

We're thrilled to unveil our new branding and website, reflecting our commitment to providing engineers with the best monitoring as code (MaC) platform for modern software stacks. Our rebranding efforts signify a new era for Checkly and highlight our commitment to continuous innovation and dedication to enabling a MaC workflow for you and your teams.