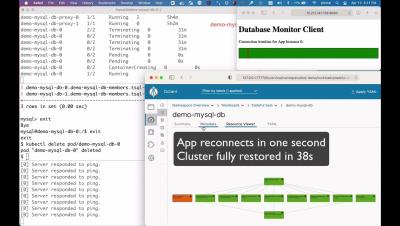
In this article, you will learn how to monitor SQL Server with Prometheus. SQL Server is a popular database, which is very straightforward to monitor with a simple Prometheus exporter. Like all databases, SQL Server has many points of failure, such as delays in transactions or too many connections in the database. We are basing this guide on Golden Signals, a reduced set of metrics that offer a wide view of a service from a user or consumer perspective.
In my previous blogs in the Dashboard Server Learning Path, we looked at working with the Web API tile and the PowerShell tile. In this instalment, let’s try the SQL tile. This tile will let you connect to any SQL database and run a SQL query straight from SquaredUp. This tile is also available in both the SquaredUp for SCOM and Azure products, so I have some familiarity with it already.
During the next four weeks, our team will work to improve the overall experience of Qovery. We gathered all your feedback (thank you to our wonderful community 🙏), and we decided to make significant changes to make Qovery a better place to deploy and manage your apps. This series will reveal all the changes and features you will get in the next major release of Qovery. Let's go!
Monitoring AWS RDS may require some observability strategy changes if you switched from a classic on-prem MySQL/PostgreSQL solution. AWS RDS is a great solution that helps you focus on the data, and forget about bare metal, patches, backups, etc. However, since you don’t have direct access to the machine, you’ll need to adapt your monitoring platform.
Organizations are changing fast to keep up with business demands. Digital transformation is being driven by the business, but IT (central and business-run) is making it happen. As they take on new database platforms, analytics tools and other digital transformation initiatives, an organization’s ability to empower their people and processes with data can be a game-changer.
Grafana is a popular way of monitoring and analysing data. You can use it to build dashboards for visualizing, analyzing, querying, and alerting on data when it meets certain conditions. In this post, we’ll look at an overview of integrating data sources with Grafana for visualizations and analysis, connecting NoSQL systems to Grafana as data sources, and look at an in-depth example of connecting MongoDB as a Grafana data source.