Operations | Monitoring | ITSM | DevOps | Cloud
September 2022
10+ Best MongoDB Monitoring Tools and Services [2022 Comparison]
MongoDB is a cross-platform NoSQL database that uses JSON-like documents with optional schema to store data. It was designed for high availability, high performance for high-data persistance use cases, and automatic scaling. Of course, all with the right infrastructure in mind. It is usually a good choice for document-oriented use cases when you need quick prototyping or massive scale. With the massive scale comes massive traffic, though.
Redis Monitoring
Redis is a popular open-source, in-memory data store used across industries by a variety of companies, including Github, Stack Overflow, Twitter and Netdata! Redis supports multiple use-cases including.
The benefits of running Microsoft SQL Server on Ubuntu Pro
Since November 2021, Canonical and Microsoft have been offering a jointly supported Microsoft SQL Server on Ubuntu Pro solution. With this offering, you can set up an optimised configuration of SQL Server on Ubuntu in a few steps. As database professionals, we should ensure the highest possible standards for database security and availability. In this blog, we will detail how the combination of SQL Server and Ubuntu Pro can help you achieve those goals.
Inside the migration from Consul to memberlist at Grafana Labs
At Grafana Labs we run a lot of distributed databases. These distributed databases all make use of a hash ring in order to evenly distribute workloads across replicas of certain components. For a more detailed description of the architecture of our projects, check out our Mimir architecture docs.
The most accurate oracle: Discovery Oracle |WORKSHOPS|
PostgreSQL Monitoring Upgrade
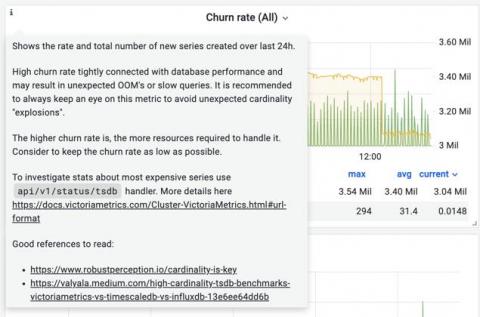
VictoriaMetrics Monitoring
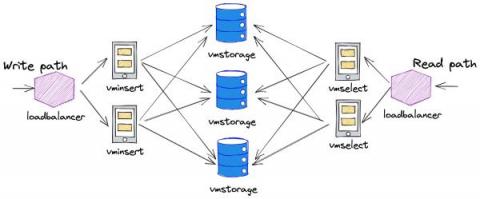
Share: VictoriaMetrics is a monitoring solution. It was designed to collect and process telemetry from many systems, provide a retrospective view, and forecast metrics for capacity planning. But what about monitoring VictoriaMetrics itself? There is one of the software development approaches called Observability Driven Development (ODD). In a nutshell, it means that developers should always keep in mind that software needs to be transparent to the person who uses it. Does your software make backups?
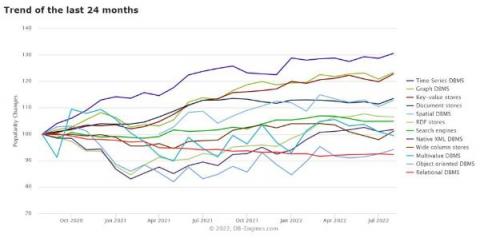
Relational Databases vs Time Series Databases
Databases are often the biggest bottleneck when it comes to application performance. Over the years a number of new database designs have emerged to help with not only basic scalability and performance but also to help improve developer productivity and make building certain types of applications easier. That isn’t to say these new databases are magical — there are always trade-offs being made and certain things are sacrificed for gains in other areas.
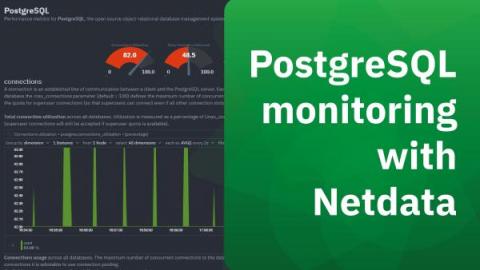
PostgreSQL Monitoring with Netdata
PostgreSQL is a popular open source object-relational database system designed to work for a wide range of workloads from single machines to data warehouses to web services with many concurrent users. PostgreSQL runs on all major operating systems and is used by teams and organizations across the world, including Netdata. If you are using PostgreSQL in production, it is crucial that you monitor it for potential issues. And the more comprehensive the monitoring the better!
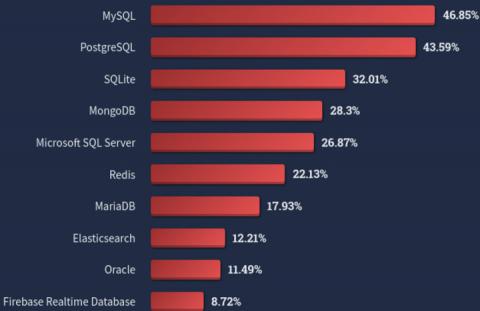
Should you use open-source databases?
You are not the only one asking this seemingly popular question! Several companies are torn between the rise in appeal of open-source databases and the undeniable challenges inherent to their adoption. Let’s explore the trends, the drivers and the challenges related to open-source database adoption.
Redgate Clone: exclusive early access to next-gen database provisioning
Grafana Mimir and VictoriaMetrics: performance tests
Grafana Labs Mimir is a new time series database under AGPLv3-license. The engineering team did a great job by taking the best from Cortex TSDB, reducing its complexity and improving scalability in the same time. According to tests by Grafana Labs, Mimir can scale to a billion active time series and 50 million samples/s ingestion rate.
List View in Icinga DB Web
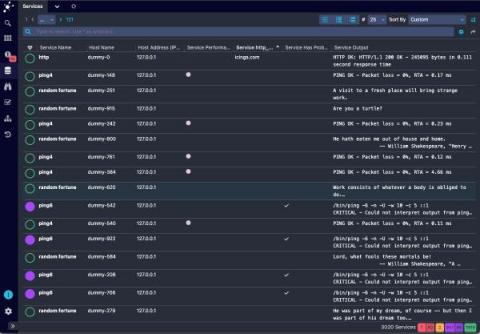
Similar, to the monitoring module in Icinga Web, Icinga DB Web also provides list views for hosts and services to provide the most common columns to reduce the backend query load.
DevOps 101: Unlocking the value of frequent deployments
Redis 7 is here
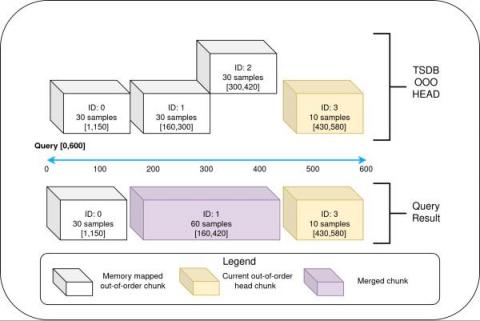
New in Grafana Mimir: Introducing out-of-order sample ingestion
Traditionally the Prometheus TSDB only accepts in-order samples that are less than one hour old, discarding everything else. Having this requirement has allowed Prometheus to be extremely efficient with how it stores samples. And in practice, it really hasn’t really been much of a limitation for users because of the pull-based model in Prometheus, which scrapes data at a regular cadence off of the targets being observed. Several use cases, however, need out-of-order support.
An introduction to Redis
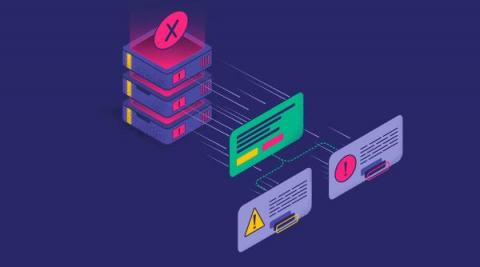
Instantly Diagnose a Database Outage with Flow Alerts
Stateful, commonly monolithic, and absolutely fundamental to system design, the quality of your database administration and operation is a key determinant of your overall success. Databases are the cornerstone of modern architecture, requiring constant effort, investigation, and iteration to get the most out of a database. This makes it all the more terrifying when an outage occurs.
Comparing PostgreSQL and MySQL Databases: Differences Explained
Database Monitoring 101: What Is It? Why Do You Need It?
Data is the foundation of the modern enterprise. Consequently, databases-in all their various forms and formats-are a critical component to the enterprise's IT ecosystem.


