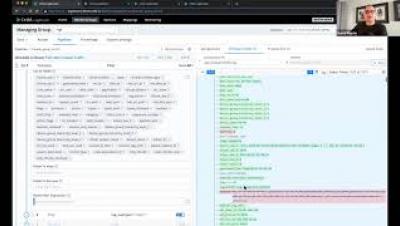
Operations | Monitoring | ITSM | DevOps | Cloud

June 2021

Observability vs. Monitoring: What's the Difference?

People often conflate monitoring and observability, and I can’t blame them. Marketers often use the terms interchangeably. However, monitoring and observability are two fundamentally different but related things. Understanding the differences between the two both technically and intuitively can help you become a better network troubleshooter, architect, and manager. After all, like many buzzwords before it, observability is an important concept if you can get past the fluff.

What Top Brands Are Saying About Splunk Observability Cloud

Customers have had a lot to say about the new Splunk Observability Cloud since we announced general availability on May 5, 2021. For the first time ever, IT and DevOps teams can get all their data in one place with unified metrics, traces and logs — collected in real time, without sampling and at any scale. What makes Splunk Observability Cloud unique from other solutions? We’ll let our customers do the talking.

Trim Unneeded Fields from Events

In case you missed it, watch this previous recording of a Cribl LogStream product webinar to get a first-hand look at the #1 machine data streaming platform. Are your events getting a little TOO eventful? In this LogStream demo, we’ll walk through how to trim any unneeded content or fields from your events, enabling your team to cut licensing costs

Designing Honeycomb for Our Users

You might have noticed some visual changes happening in Honeycomb lately. Colors, typography, icons, and some features have started to look a bit different. While these changes are just beginning to make their way into the product, we’ve been working on them for some time. Let’s look at what has been going on behind the scenes to make them happen.

How to Use Observability to Reduce MTTR

When you’re operating a web application, the last thing you want to hear is “the site is down." Regardless of the reason, the fact that it is down is enough to cause anyone responsible for an app to break out into a sweat. As soon as you become aware of an issue, a clock starts ticking — literally, in some cases — to get the issue fixed. Minimizing this time between an issue occurring and its resolution is arguably the number one goal for any operations team.

Leverage Observability With OpenTelemetry to Understand Root Cause Quickly

An observability solution should help any incident responder understand what changed and why. A lot has been written on the difference between monitoring and observability, but an easy way to understand how both are integral to incident response is to consider how customers use PagerDuty—with both monitoring and observability tools—to get to the right answer.

o11ycon Keynote

presented at o11ycon+hnycon, June 9-10, 2021 Nora Jones, CEO @ Jeli, Charity Majors, CTO & Co-founder@ Honeycomb o11ycon Keynote Nora Jones and Charity Majors will share their experiences leading major movements shaping the future of shipping software. Nora Jones is CEO of Jeli, and former engineer at Netflix and Slack will share her research and experience with Chaos Engineering, human factors, and site reliability. Charity Majors is Honeycomb's CTO and co-founder, who pioneered Observability as a software practice for modern teams.

Performance analysis for supported modules with Honeycomb

The Infrastructure Automation Content (IAC) team noticed some supported modules tests were taking significantly more time than others. David Schmitt, Principal Software Engineer on the IAC team, explains how Puppet utilises Honeycomb to debug our supported modules for potential performance bottlenecks.

Module development failure analysis with Honeycomb

Writing modules for yourself is easy, but writing modules for other people to use? Not so much. Failures in modules can have major repercussions, and our IAC team in Puppet takes that very seriously. Listen as David Schmitt and Daniel Carabas walk you through how we utilise Honeycomb for failure analysis with Github Actions during module development.

OpenTelemetry, Not Just for Production Troubleshooting

OpenTelemetry, Not Just for Production Troubleshooting: How to Prevent Downtime as Early as Local Dev OpenTelemetry is a great tool for observability and debugging in production. It provides you with data that empowers understanding of what is slow or broken, as well as what you can do to fix problems that occur in production. But what if you could leverage those same OpenTelemetry capabilities in pre-production? What if you could use those capabilities during development and testing phases to proactively prevent downtime in production?

Conditional Distributed Tracing

Distributed tracing is generally a binary affair—it's off or on. Either a trace is sampled or, according to a flag, it's not. Span placement is also assumed to be an "always-on" system where spans are always added if the trace is active. For general availability and service-level objectives, this is usually good enough. But when we encounter problems, we need more. In this talk, I'll show you how to "turn up the dial" with detailed diagnostic spans and span events that are inserted using dynamic conditions.

Observability is More Fun With Friends: Stories From OpenTelemetry Collaboration

Panel Guests: Amy Tobey | Equinix Metal, Andrew Hayworth | GitHub, Liz Fong-Jones | Honeycomb, Ted Young | Lightstep The modern open source landscape is hard enough, given the (sometimes) conflicting interests of commercial partners, end-users, and project maintainers. It takes a real, intentional effort to build collaborative relationships across these groups in order to make improvements to projects. In this panel, we'll share stories about what's worked from our involvement in OpenTelemetry as maintainers, community representatives, and end-users.

How To Implement Cloud Observability Like A Pro | Pepperdata

Do traditional on-prem observability techniques translate to the cloud? Many big data enterprises lack observability and thus struggle to manage and understand unprecedented amounts of data in the cloud. A monitoring solution may alert to a problem, but it can’t pinpoint the issue or quickly get to the root cause.

Data Availability Isn't Observability

But it’s better than nothing… Most of the industry is racing to adopt better observability practices, and they’re discovering lots of power in being able to see and measure what their systems are doing. High data availability is better than none, so for the time being, what we get is often impressive. There’s a qualitative difference between observability and data availability, and this post aims to highlight it and orient how we structure our telemetry.

The State of Observability in 2021

Today, we released our second annual Observability Maturity Community Research Findings report. This year-over-year report identifies trends occurring in the observability community that we use to further develop our Observability Maturity Model. Our goal in running this annual report is to understand community perceptions and awareness of observability, how engineering teams are approaching observability, and mapping an observability maturity model that reflects current research findings.

The Crossroad of Security & Observability in Kubernetes: A Fireside Chat

Security as an afterthought is no longer an option and must be deeply embedded in the design and implementation of the products that will be running in the cloud. It is increasingly more critical for many security teams to be almost, if not equally, knowledgeable of the emerging and rapidly evolving technology. Join Manish Sampat from Tigera, as explores the topic in detail with Stan Lee from Paypal.

Service Mesh, Observability and Beyond - Sheetal Joshi, AWS

Congratulations! You’re now cloud-native with microservices. No more legacy monoliths. However, troubleshooting takes time, debugging is difficult, and security is scary. How can you scale your organization without losing an understanding of your environment? Services mesh is here to help! It gives you the observability of connected services and is easier to adopt than you might think. Come and learn service mesh concepts, best practices, and key challenges.

Kubernetes Observability & Troubleshooting: Best Practices - Raj Singh, Box

Early adoption of Kubernetes came with its set of challenges for Box, that led to innovative solutions & learnings. In this session, the speaker will take you through some of those solutions around Kubernetes Observability & best practices which will make your Kubernetes journey easier.

Beyond the network: Next Generation Security and Observability with eBPF - Shaun Crampton, Tigera

Learn how eBPF will bring a richer picture of what's going on in your cluster, without changing your applications. With eBPF we can safely collect information from deep within your applications, wherever they interact with the kernel. For example, collecting detailed socket statistics to root-cause network issues, or pinpointing the precise binary inside a container that made a particular request for your audit trail. This allows for insights into the behavior (and security) of the system that previously would have needed every process to be (manually) instrumented.

Join Us to learn Service Mesh, Observability and Beyond

How can you scale your organization without losing an understanding of your environment? Services mesh is here to help! It gives you the observability of connected services and is easier to adopt than you might think. Come and learn service mesh concepts, best practices, and key challenges.

Ensuring adequate security, observability, & compliance for cloud native applications

Containers, Microservices, and cloud-based applications have revolutionized the way companies build and deliver products globally. This has also changed the attack surface and requires very different security strategies and tools to avoid exposure to sensitive information and other cyber attacks. Regulatory compliance has also evolved making it ever so important for companies to adapt to this new paradigm.

A New Approach to Metrics

Today at o11ycon+hnycon—right now, actually, if you’re reading this blog when it was posted—we’re announcing several new Honeycomb features during the keynote. Our industry and community have come a long way since we burst onto the scene, and I’m delighted to give you another version of Honeycomb that continues to demonstrate what’s possible with observability. And it includes metrics.

Multi-Project Cloud Monitoring made easier

Customers need scale and flexibility from their cloud and this extends into supporting services such as monitoring and logging. Google Cloud’s Monitoring and Logging observability services are built on the same platforms used by all of Google that handle over 16 million metrics queries per second, 2.5 exabytes of logs per month, and over 14 quadrillion metric points on disk, as of 2020.

Unified Observability: A Business-Centric View

Here at LogicMonitor, we’re on a mission to build the most comprehensive, extensible, and intelligent monitoring and observability platform in the world to help businesses run seamlessly. We’ve spent more than a decade building a best-in-class monitoring platform. Over the past two years, however, we have further evolved our platform to deliver invaluable end-to-end observability across applications, networks, and infrastructure for companies of all sizes and in a variety of industries.

Total Economic Impact study: Elastic delivers 10X performance with up to 75% cost savings

Ten times faster at a fraction of the cost. If you want a headline as to why you should consider adopting Elastic for security and observability, that is it. We often work with our customers to help them establish the business value of Elastic within their organizations. We commissioned Forrester to conduct a Total Economic Impact (TEI) study of our security and observability solutions so our customers have an unbiased view that they can share with their internal stakeholders.

Chapter 7: In Which Sarah Experiments with Observable Low-Code

This is the seventh chapter in a series of blog posts exploring the role that intelligent observability plays in the day-to-day life of smart teams. In this chapter, our DevOps Engineer, Sarah, experiments with low code and Moogsoft in her team’s DevOps toolchain to rush a new feature out the door to keep up with a competitor.

Anomaly Detection on Observability Data using Machine Learning

Machine learning helps detect undesired behaviors in your observability data. This makes it easier to spot performance degradation in your applications, services, or instances. In this video, you'll learn how to automate anomaly detections using machine learning on your observability data.

Why Are SaaS Observability Tools So Far Behind?

Salesforce was the first of many SaaS-based companies to succeed and see massive growth. Since they first started out in 1999, Software-as-a-Service (SaaS) tools have taken the IT sector and, well the world, by storm. For one, they mitigate bloatware by moving applications from the client’s computer to the cloud. Plus, the sheer ease of use brought by cloud-based, plug-and-play software solutions has transformed all sorts of sectors.

Planning Center: Simplifying observability and reducing MTTR in a serverless world, with Datadog

Justin Bodeutsch, Systems Administrator at Planning Center discusses how Datadog’s alerting, log management, serverless, and infrastructure monitoring tools have simplified internal processes and been instrumental in minimizing MTTR across the business.

Observability From the Application to the Edge

Observability is a buzzword right now. Rightly so, as many companies are greatly concerned about what’s happening with their systems. Every company has become a software company and if they aren’t, they are being disrupted by one. IT leaders have more weight on their shoulders than ever before and it’s because digitization is rapidly changing the way people consume nearly everything.