Speedscale Partners With New Relic
Speedscale Teams Up with New Relic Instant Observability.


In this blog post we’ll help answer the age old question, “What does this service talk to and what does it say?” We’ll see how to inspect inbound and outbound REST API calls to see what calls are being made and what incoming traffic causes a reaction. This can be pretty handy when you’re taking over maintenance of an existing service, or if your code just isn’t behaving the way you expect.
Ooh, good question! My favorite thing about this part of the year is that work slows down, everybody is on vacation, and those of us not traveling get to work on little projects that we’re too busy to touch most of the year. As Martin Thwaites put it: “The Product Owners are away, the devs will play.” For Martin, this year, “play” means adding tracing to more of their services.
On Dec. 8, we gathered the Grafana EMEA community for another dynamic meetup. Experts from the Grafana Labs and k6 teams alongside observability pros from different organizations covered topics ranging from shift left observability practices to monitoring your green thumb at home with Grafana. In case you missed the virtual get together, here’s a recap of each talk along with the session videos.
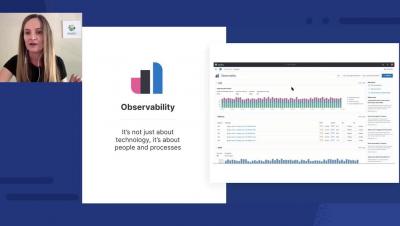
IDC's new white paper delves into full-stack observability — what it is, why it’s different from traditional monitoring and the value that it can provide.
At Honeycomb Developer Week, I got an opportunity to walk through a couple of fun new features we’ve shipped since August and ways that we’ve been able to improve Honeycomb for you. Hearing feedback from our users and customers— through support requests, in the Pollinators community, from Twitter, etc.—helps us make Honeycomb better for you.
Getting started with observability can be time consuming. It takes time to configure your apps and practice to change the way you approach troubleshooting. So it can be hard to prioritize investing time, especially if you can’t clearly see how that investment will pay off. That’s why we put together Honeycomb Developer Week: short, snackable, time-efficient learning sessions to jumpstart your observability journey.
Automation takes repetitive tasks off professionals’ plates, empowering them to free up time to focus on more valuable activities. Moogsoft’s API-driven automation capabilities enable SREs to make better use of their time, leading to better results for the business.
Asking an IT engineer or SRE to define the purpose of observability is kind of like asking someone to explain the purpose of life: There are lots of different opinions out there, and no way of proving any of them right or wrong. You could argue that observability is just a buzzword that refers to what used to be called monitoring.
Sensu’s observability pipeline includes resources for collecting, filtering, transforming, and processing observability data: checks, event filters, mutators, and handlers. These resources and Sensu’s observability pipeline concept are well seasoned and widely used at thousands of companies. However, configuration can be somewhat unintuitive, especially for new users.
An explanation of observability that highlights the role observability data play in supporting the active role of SREs as they reduce toil, improve uptime, and judiciously consume the error budget.
Interest in observability is at an all-time high. When we attended KubeCon in Los Angeles in October, observability and security were everywhere—in conversations with attendees and other vendors, during sessions, and in messaging at booths—indicating that there’s still an unmet need. In fact, Gartner declared that observability is at the ‘peak of inflated expectations' in a recent Hype Cycle report.
Have you ever deep dived into the sea of your tracing data, but wanted additional context around your underlying system? For instance, it may be easy to see when/where certain users are experiencing latency, but what if you needed to know what garbage collection is mucking up the place or which allocated memory is taking a beating? Imagine having a complete visual on how an application is performing when you need it, without having to manually dig through logs and multiple UI screens.
In 2021, any time that you access any kind of web service, whether it be via a website or app, chances are high that the backend is running on Kubernetes. Hundreds of thousands of organizations rely on Kubernetes to power and manage their mission critical services every day, and the reliability and scalability benefits offered by Kubernetes have been felt across the industry.
In the computing world, Observability and Monitoring has got an important place. The recent days have witnessed a great use of these terms in the IT infrastructure and among the developers, as observability and monitoring have been extremely effective in tracking the events. Both systems are intertwined to each other, but there is a small line of separation among the two. What? Why? What's the difference? These are the questions that has to be answered. Let's figure out the reasons here.
Observability is one of the most popular topics in technology at the moment, and that isn’t showing any sign of changing soon. Agentless log collection, automated analysis, and machine learning insights are all features and tools that organizations are investigating to optimize their systems’ observability. However, there is a new kid on the block that has been gaining traction at conferences and online: the Extended Berkeley Packet Filter, or eBPF. So, what is eBPF?
“Work from anywhere” is now a common occurrence. With so many companies now dependent on a distributed workforce, IT teams need to be able to quickly diagnose and troubleshoot WiFi problems. Moreover, they, themselves, are often working remotely. In order to successfully do their jobs, consistent WiFi is obviously essential for remote workers.
Today, I found a bug before I noticed it. Like, it was subtle, and so I wasn’t quite sure I saw it—maybe I hadn’t hit refresh yet? Later, I looked at the trace of my function and, boom, there was a clear bug. Here’s the function with the bug. It responds to a request to /win by saving a record of the win and returning the total of my winnings so far. Can you spot the problem in the TypeScript? It’s subtle. Now here’s a trace in Honeycomb: Now do you see the bug?
Elastic Observability 7.16 introduces curated data exploration views for ad hoc analysis and further extends visibility into complex and distributed systems with the general availability (GA) of dozens of prebuilt Elastic Agent data integrations, observability tooling for continuous integration and continuous delivery (CI/CD) pipelines, and a new native data source integration with Amazon Web Services (AWS) FireLens. These new features allow customers to.
I can’t remember the last time I drove down highway 101 between San Francisco and the South Bay and didn’t see a billboard claiming to be the single tool to solve all of my data problems.
I have a good sense of how to use traces to understand my system’s behavior within request/response cycles. What about multi-request processes? What about async tasks spawned within a request? Is there a higher-level or more holistic approach?
As one of the leading enterprise collaboration software globally, Microsoft Teams helps remote workers come together and stay productive. But while IT already has tools to monitor Teams call quality metrics, the pandemic shifted the organizational landscape with all of us working remotely from home. Or at least work in a hybrid way! So what does that mean for Teams monitoring now? The shift necessitates a newer Microsoft Teams monitoring strategy approach that combines synthetics with real user monitoring (RUM) to get a complete seamless digital experience.