Operations | Monitoring | ITSM | DevOps | Cloud
April 2021
Extend IT Observability to the Cloud - Deep Dive of SquaredUp Cloud
Dashboard Anything - Deep Dive of Dashboard Server
Digital Transformation and its Impact on IT Operations
Customer Spotlight - Award for Outstanding Dashboard
Product Training - How to Dashboard Azure Costs and Resources
Panel Discussion & Closing
NiCE VMware Monitoring Adds Value 2021Q2
SquaredUp 5.1 is here
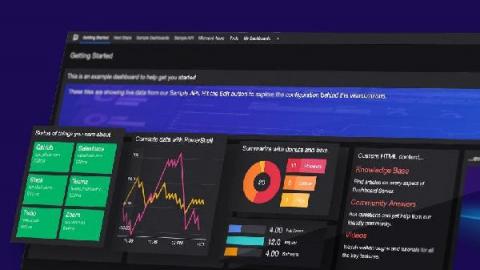
We are delighted to announce that SquaredUp 5.1 is now available! With this latest update, we are introducing new integrations and visualizations that extend the picture of your business services and applications by unlocking even more of your data that is trapped within silos. You can now get insights on your enterprise applications from any angle! These features are available in all our products, including our newest product Dashboard Server.
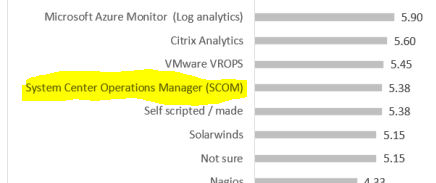
Why the VDI Like a Pro Survey - 2021 - Monitoring Poll result for SCOM is false
Why The VDI Like a Pro - EUC - State of the Union - 2021 - Monitoring Poll result for SCOM is false.
Product Training - Beyond Infrastructure Map & Monitor Critical Applications
Product Training - How to Build the Ultimate SCOM Console
Dashboard Server: Working with the SQL tile
In my previous blogs in the Dashboard Server Learning Path, we looked at working with the Web API tile and the PowerShell tile. In this instalment, let’s try the SQL tile. This tile will let you connect to any SQL database and run a SQL query straight from SquaredUp. This tile is also available in both the SquaredUp for SCOM and Azure products, so I have some familiarity with it already.
Dashboard Server - Introduction
Dashboard Server - Create your first dashboard
Dashboard Server - Visualising from an API
Dashboard Server - Share with Open Access
Dashboard Server: Working with the PowerShell tile
Amongst all the cool features of SquaredUp Dashboard Server, the coolest kid on the block is probably the PowerShell tile. The reason is simple – PowerShell is easy, it’s awesome, and it’s powerful! You can not only retrieve data from the source (like the APIs), but you can also manipulate that data, work with variables, loop it, filter it, and use it in whichever way works the best. Like they say, the things PowerShell can do are only restricted by the proficiency of the user.
NiCE Management Pack 3.3 for Microsoft 365 released
The NiCE Active 365 Management Pack for SCOM enables advanced monitoring for Microsoft 365, Teams, SharePoint, OneDrive, Exchange, and AAD Connect in hybrid environments. It ensures end-to-end control for your Microsoft 365 cloud and hybrid services. The new NiCE Active 365 Management Pack 3.3 release comes with great new features.
The benefits and challenges of a single pane of glass
SCOM 2019 is a monitoring powerhouse. Its capabilities are unmatched. But it also has some serious issues when it comes to unearthing and visualizing the valuable data locked inside. The replacement of Silverlight with HTML5 in the SCOM 2019 web console was a welcome enhancement, but the SCOM web console still shares its design with the administration console, which is slow, complex, and makes it downright difficult to get the visibility you need.
Dashboard Server: Working with the WebAPI tile
Now that we’ve familiarized ourselves with the basics, let’s get on creating our first dashboard! I spot an familiar tile here, the WebAPI tile. This tile is available in the SquaredUp SCOM and Azure products too. WebAPI tile is the way you bring external data into SquaredUp. As long as the tool you’re connecting to has an API endpoint that returns data in JSON payload, you can work with that data to display the data in a dashboard in SquaredUp.
How to tune a group in SCOM
Groups are key to managing and maintaining Microsoft’s System Center Operations Manager (SCOM). The typical way to assign an object to your group is by using its class to define the desired object. Once you set up a group you will then want to apply overrides so you can change the parameters or rules that govern that specific group.


