Operations | Monitoring | ITSM | DevOps | Cloud

Latest Posts

Grafana Cloud updates: revamped Synthetic Monitoring, improvements to Kubernetes Monitoring, and more

We consistently release helpful updates and fun features in Grafana Cloud, our fully managed observability platform powered by the open source Grafana LGTM Stack (Loki for logs, Grafana for visualization, Tempo for traces, and Mimir for metrics). In case you missed it, here’s a roundup of the latest and greatest updates for Grafana Cloud this month. You can also read about all the features we add to Grafana Cloud in our What’s New in Grafana Cloud documentation.

AI-powered insights for continuous profiling: introducing Flame graph AI in Grafana Cloud

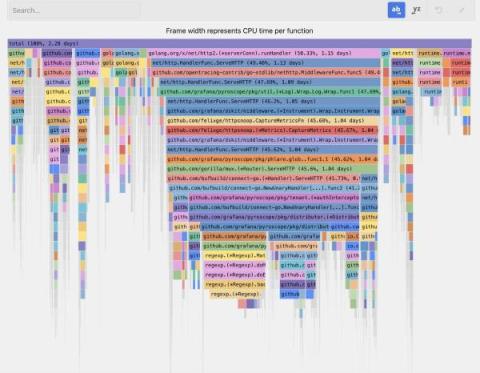
Like many in the observability space, we see a lot of potential in harnessing AI to enhance the developer experience. As we continue to evolve and expand our observability platform, we strive to develop features that not only solve complex problems, but make it easier to access and derive value from tools like Grafana Pyroscope.

How to explore metrics without PromQL queries in Grafana

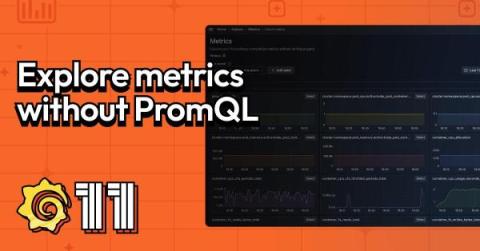
At GrafanaCON 2024, Grafana founder Torkel Ödegaard introduced Grafana 11, which has a feature set that aligns with the same goals we’ve had since the OSS project launched in 2013. “The core mission of Grafana that we’ve had from the start is to make observability easy and powerful through good UX design, a focus on ease of use, and user flexibility and freedom,” Torkel said.

Grafana transformations: 10 new ways to get more out of your data

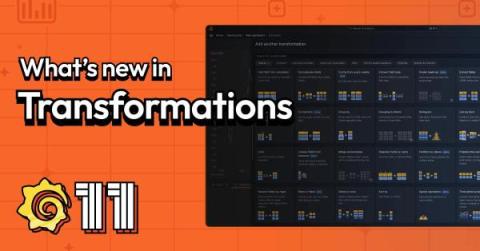
One of the superpowers of Grafana is the ability to bring all of your data into a single platform thanks to our rich catalog of data sources. Oftentimes you will want to visualize information from disparate data sources together in a single dashboard or panel. Or you might want to refine data returned from queries without altering the original data source. Or you may need to modify data due to limitations of a query language that stops you from getting the required formatting.

Grafana Alerting: new tools to resolve incidents faster and avoid alert fatigue

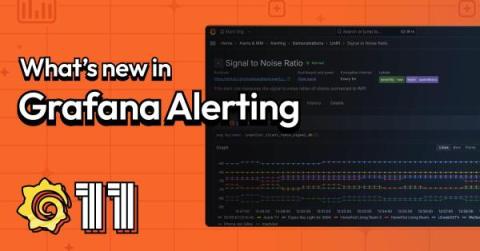
The maturity of your alerting strategy has a direct impact on the reliability of your infrastructure and your applications. It can also have a big impact on engineering productivity. So whether you’re talking about resolving incidents faster or avoiding alerting fatigue, alerting should always be front and center.

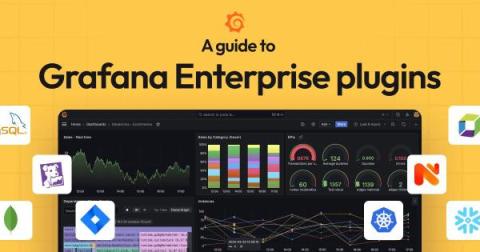
Grafana Enterprise data source plugins: A brief guide to what they are and how to get started

One of the most powerful features of Grafana is the ability to unify and derive value from your data, regardless of where that data lives. This is because we’re fully committed to making Grafana an open, composable, and extensible observability platform for our more than 20 million users worldwide. But how exactly do we deliver on that promise of openness and extensibility? Grafana data source plugins play a big role.

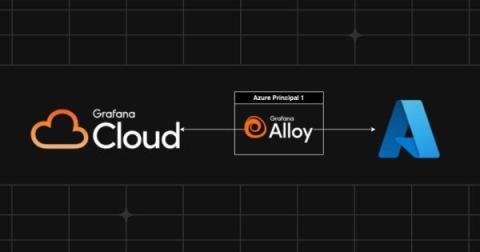
Use Grafana Alloy to collect Azure metrics with less hassle

Are you using the Azure metrics exporter to ship telemetry data to Grafana Cloud? Are you overwhelmed with the amount of configuration and complexity necessary to avoid being rate limited? Well, did you know that with Grafana Alloy, our distribution of the OpenTelemetry Collector with built-in Prometheus pipelines and support for metrics, logs, traces, and profiles, you can now: Let’s look at how these two features can reduce the complexity of your Alloy configuration.

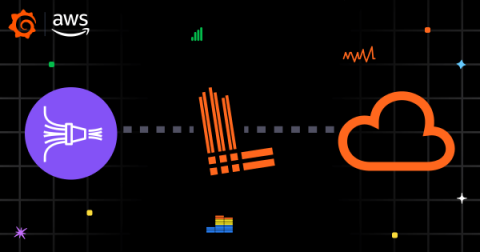
Logs with Firehose: Stream logs to the AWS Observability app cheaper and easier

AWS is an essential part of many organizations’ tech stacks today, which is why we continue to make it easier to observe your environment in Grafana Cloud. We recently launched AWS Observability, a fully managed application for visualizing and alerting on dozens of AWS offerings. And with our latest update, we’re making it cheaper and simpler to ingest and query your AWS logs.

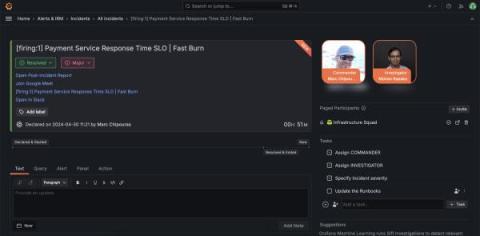
Grafana Incident: new tools for faster, simpler incident response

At Grafana Labs, we’re committed to helping teams dramatically improve how they manage and respond to incidents. Through Grafana Incident Response & Management (IRM), we provide tools to empower teams, streamline processes, and enhance the effectiveness of incident management strategies—and we’re constantly looking for ways to make our solution even better.

Data source security in Grafana: Best practices and what to avoid

Recently, an incorrect security report was published, claiming that there’s a SQL injection attack in Grafana. As we have communicated to the security researcher, this report is wrong. Authenticated users in Grafana have the same permissions as the user configured for the underlying data source.