Grafana

New York, NY, USA
2014
  |  By David Allen
Grafana dashboards are a great way to combine a lot of technical information into one convenient picture. From time to time, it’s also useful to export data from a particular Grafana visualization to another format, so you can further analyze it and share it with others. In this blog post, we’ll walk through how to export CSV data for any Grafana visualization you use. This makes it easy to get that data into popular spreadsheet applications, such as Microsoft Excel or Google Sheets. =
  |  By Salva Corts
As we discussed when we rolled out the latest major release of Grafana Loki, we’ve grown the log aggregation system over the past five years by balancing feature development with supporting users at scale. A big part of the latter has been making queries much faster — and that was a major focus with Loki 3.0 too. We’ve seen peak query throughput grow from 10 GB/s in our Loki 1.0 days to greater than 1 TB/s even before 3.0.
  |  By Vadim Stepanov
Every moment counts when you’re managing incidents that can affect your services and customers. That’s why we’re excited to introduce a new bi-directional integration between Grafana OnCall and ServiceNow, a popular platform many large organizations rely on to help manage their incidents.
  |  By Kamel Djoudi
OpenTelemetry has emerged as the go-to open source solution for collecting telemetry data, including traces, metrics, and logs. What’s especially unique about the project is its focus on breaking free from the reliance on proprietary code to offer users greater control and flexibility. As a senior solutions engineer here at Grafana Labs, I’ve spent a lot of time exploring OpenTelemetry, including in my spare time.
  |  By Kyle Eckhart
In the wide world of observability, you have many options for visualizing metrics collected by Amazon CloudWatch. And because of that, you’re often left making lots of decisions — about cost, configurations, flexibility, and more. At Grafana Labs, we stick to our “big tent” philosophy, which means we don’t force you into a decision or even tell you that you have to bring your CloudWatch metrics to Grafana Cloud.
  |  By Marc Tuduri
At GrafanaCON last month, we announced Grafana Alloy, our open source distribution of the OpenTelemetry Collector. Alloy is a telemetry collector that is 100% OTLP compatible and offers native pipelines for OpenTelemetry and Prometheus telemetry formats, supporting metrics, logs, traces, and profiles. Today, we are excited to share that Grafana Beyla is now available in Grafana Alloy as the default eBPF-based application auto-instrumentation solution.
  |  By Matías Bordese
One important consideration when adopting a tool is whether it can integrate with your existing workflows and services. Each scenario can be highly specific, which is why it’s important to look for tools that have a public API or customizable webhooks. Last year, Grafana OnCall expanded its webhook support to allow for more complex setups, offering greater flexibility to interact with other services during alert group events.
  |  By Kristin Knapp
We consistently release helpful updates and fun features in Grafana Cloud, our fully managed observability platform powered by the open source Grafana LGTM Stack (Loki for logs, Grafana for visualization, Tempo for traces, and Mimir for metrics). In case you missed it, here’s a roundup of the latest and greatest updates for Grafana Cloud this month. You can also read about all the features we add to Grafana Cloud in our What’s New in Grafana Cloud documentation.
  |  By Ryan Perry
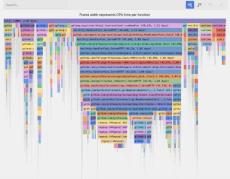
Like many in the observability space, we see a lot of potential in harnessing AI to enhance the developer experience. As we continue to evolve and expand our observability platform, we strive to develop features that not only solve complex problems, but make it easier to access and derive value from tools like Grafana Pyroscope.
  |  By Ryan Kehoe
The maturity of your alerting strategy has a direct impact on the reliability of your infrastructure and your applications. It can also have a big impact on engineering productivity. So whether you’re talking about resolving incidents faster or avoiding alerting fatigue, alerting should always be front and center.
  |  By Grafana
In this video, Grafana Developer Advocate Leandro Melendez lists all the supported Operating Systems in which a user can get Grafana running in their local computers and on each he shows the ways in which you can get Grafana OSS up and running.
  |  By Grafana
In this video, we'll walk you through the steps to instrument a React application with Grafana Faro for comprehensive monitoring and insights.
  |  By Grafana
Have you just discovered Grafana Loki? In this Zero to Hero episode, we dive deeper into how to ingest your logs into Loki. Buckle up and get ready to learn about: Grafana Cloud is the easiest way to get started with Grafana dashboards, metrics, logs, and traces. Our forever-free tier includes access to 10k metrics, 50GB logs, 50GB traces and more. We also have plans for every use case.
  |  By Grafana
Meet Dr. Christopher Field, our 2024 Golden Grot award winner in the professional category. Dr. Field is the Co-founder and President of Theia Scientific, whose software helps researchers stream images from room-sized electron microscopes to a time series database and machine learning models that are used to instantly identify defects in alloy.
  |  By Grafana
Do you want to know what an alert list visualization is and how you can create one in Grafana? Join Senior Developer Advocate Marie Cruz in this beginner-friendly tutorial to learn how alert list visualization works in Grafana. Grafana Cloud is the easiest way to get started with Grafana dashboards, metrics, logs, and traces. Our forever-free tier includes access to 10k metrics, 50GB logs, 50GB traces and more. We also have plans for every use case.
  |  By Grafana
Do you want to know what a dashboard list visualization is and how you can create one in Grafana? Join Senior Developer Advocate Marie Cruz in this beginner-friendly tutorial to learn how dashboard list visualization works in Grafana. Grafana Cloud is the easiest way to get started with Grafana dashboards, metrics, logs, and traces.
  |  By Grafana
Grafana 11 is now GA! In this video, we do a deep dive exploring all of the new features for our developers. In this video, learn more about: Grafana Cloud is the easiest way to get started with Grafana dashboards, metrics, logs, and traces. Our forever-free tier includes access to 10k metrics, 50GB logs, 50GB traces and more. We also have plans for every use case.
  |  By Grafana
Grafana 11 is now GA! In this video, we do a deep dive exploring all of the new features for our operators.
  |  By Grafana
Grafana 11 is now GA! In this video, we do a deep dive exploring all of the new features for our users.
  |  By Grafana
If you'r building OSS observability, you'll want to use the databases Mimir, Loki, Tempo, and Pyroscope. This video explains why and the new features that are coming out for these databases.

Grafana provides a powerful and elegant way to create, explore, and share dashboards and data with your team and the world. Grafana is most commonly used for visualizing time series data for Internet infrastructure and application analytics but many use it in other domains including industrial sensors, home automation, weather, and process control.

Grafana has a robust plugin architecture built for extensibility. Visualize data from more than 40 data sources, including commercial databases and web vendors, and add new graph panels with rich data visualization options. There is built in support for many of the most popular time series data sources. It works with Graphite, Elasticsearch, Cloudwatch, Prometheus, InfluxDB and more.

Grafana Labs is the company behind Grafana, the leading open source software for visualizing time series data. Grafana Labs helps users get the most out of Grafana, enabling them to take control of their unified monitoring and avoid vendor lock in and the spiraling costs of closed solutions.