Operations | Monitoring | ITSM | DevOps | Cloud

Dashboards

How to Achieve Observability as Code with Grafana | LiveRamp at ObservabilityCON on the Road 2024

Leveraging Terraform alongside Grafana, Kubernetes, and Helm providers, the SRE team at LiveRamp has transformed every aspect of their operational toolkit. From agent installations and synthetic checks to Grafana k6 performance testing, notification policies, contact points, and alerts into modular, code-based components, the team is crafting a cutting-edge observability solution powered by Grafana Cloud. Learn how this seamless integration ensures a robust, scalable, and easily manageable infrastructure that is setting new benchmarks for system reliability and efficiency around the business.

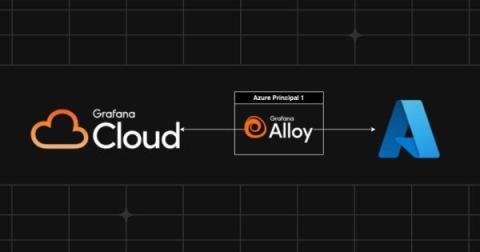
Use Grafana Alloy to collect Azure metrics with less hassle

Are you using the Azure metrics exporter to ship telemetry data to Grafana Cloud? Are you overwhelmed with the amount of configuration and complexity necessary to avoid being rate limited? Well, did you know that with Grafana Alloy, our distribution of the OpenTelemetry Collector with built-in Prometheus pipelines and support for metrics, logs, traces, and profiles, you can now: Let’s look at how these two features can reduce the complexity of your Alloy configuration.

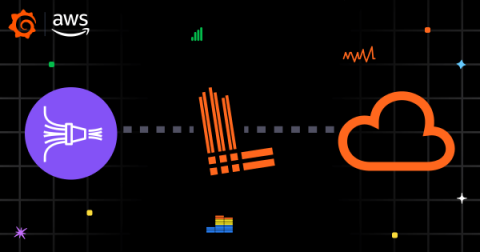
Logs with Firehose: Stream logs to the AWS Observability app cheaper and easier

AWS is an essential part of many organizations’ tech stacks today, which is why we continue to make it easier to observe your environment in Grafana Cloud. We recently launched AWS Observability, a fully managed application for visualizing and alerting on dozens of AWS offerings. And with our latest update, we’re making it cheaper and simpler to ingest and query your AWS logs.

How to Stream AWS Logs to Grafana Cloud via Amazon Data Firehose | Grafana

In this video, we show you the steps to configure your Grafana account so you can start streaming AWS logs to Grafana Cloud using Amazon Data Firehose. It takes just a few minutes to set up so you can see your logs in Grafana Explore. Save money and time by using this new approach!

Data source security in Grafana: Best practices and what to avoid

Recently, an incorrect security report was published, claiming that there’s a SQL injection attack in Grafana. As we have communicated to the security researcher, this report is wrong. Authenticated users in Grafana have the same permissions as the user configured for the underlying data source.

Understanding Dashboards in Grafana | Panels, Visualizations, Queries, and Transformations

Gain a fundamental understanding of what Dashboards are in Grafana and how they can be used to visualise your data to ensure your systems remain healthy and operational. We'll cover the must know concepts, including panels, visualizations, queries, and transformations, that will ensure you have all the tools you need to build awesome dashboards in Grafana. Chapters: ☁️ Grafana Cloud is the easiest way to get started with Grafana dashboards, metrics, logs, and traces. Our forever-free tier includes access to 10k metrics, 50GB logs, 50GB traces and more. We also have plans for every use case.

Securing Dashboards in a Command Line World with Marc Boorshtein

Join Marc Boorshtein, CTO of Tremolo Security and Kubernetes expert, as he explores how to secure Kubernetes dashboards effectively in a command line-centric setup. From discussing the advantages of dashboards to unveiling critical security practices, Marc offers a comprehensive guide to safeguarding your Kubernetes environment.