Operations | Monitoring | ITSM | DevOps | Cloud

Grafana

How to use Grafana Beyla in Grafana Alloy for eBPF-based auto-instrumentation

At GrafanaCON last month, we announced Grafana Alloy, our open source distribution of the OpenTelemetry Collector. Alloy is a telemetry collector that is 100% OTLP compatible and offers native pipelines for OpenTelemetry and Prometheus telemetry formats, supporting metrics, logs, traces, and profiles. Today, we are excited to share that Grafana Beyla is now available in Grafana Alloy as the default eBPF-based application auto-instrumentation solution.

Beginners Guide - All about Dashboard List visualization | Grafana

Do you want to know what a dashboard list visualization is and how you can create one in Grafana? Join Senior Developer Advocate Marie Cruz in this beginner-friendly tutorial to learn how dashboard list visualization works in Grafana. Grafana Cloud is the easiest way to get started with Grafana dashboards, metrics, logs, and traces.

Grafana OnCall: Connect to Discord, Mattermost, and more with webhooks

One important consideration when adopting a tool is whether it can integrate with your existing workflows and services. Each scenario can be highly specific, which is why it’s important to look for tools that have a public API or customizable webhooks. Last year, Grafana OnCall expanded its webhook support to allow for more complex setups, offering greater flexibility to interact with other services during alert group events.

Grafana 11 Features for Developers | Grafana

Grafana 11 is now GA! In this video, we do a deep dive exploring all of the new features for our developers. In this video, learn more about: Grafana Cloud is the easiest way to get started with Grafana dashboards, metrics, logs, and traces. Our forever-free tier includes access to 10k metrics, 50GB logs, 50GB traces and more. We also have plans for every use case.

Grafana Cloud updates: revamped Synthetic Monitoring, improvements to Kubernetes Monitoring, and more

We consistently release helpful updates and fun features in Grafana Cloud, our fully managed observability platform powered by the open source Grafana LGTM Stack (Loki for logs, Grafana for visualization, Tempo for traces, and Mimir for metrics). In case you missed it, here’s a roundup of the latest and greatest updates for Grafana Cloud this month. You can also read about all the features we add to Grafana Cloud in our What’s New in Grafana Cloud documentation.

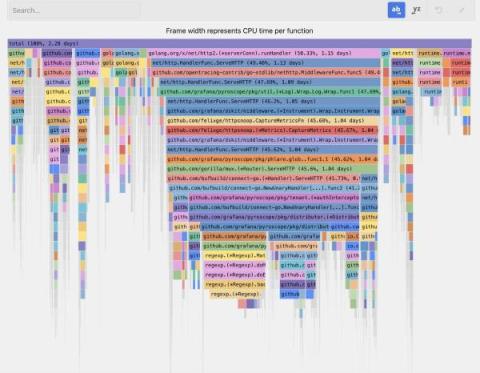
AI-powered insights for continuous profiling: introducing Flame graph AI in Grafana Cloud

Like many in the observability space, we see a lot of potential in harnessing AI to enhance the developer experience. As we continue to evolve and expand our observability platform, we strive to develop features that not only solve complex problems, but make it easier to access and derive value from tools like Grafana Pyroscope.