Operations | Monitoring | ITSM | DevOps | Cloud
June 2021
This Month in Datadog: June 2021 (Episode 2)
Full Stack Django Monitoring, Part 2
Service Desk Automation Demands Deep Integration with Monitoring Tools
ITIL’s definition of a service desk is: “The single point of contact between the service provider and the users. A typical service desk manages incidents and service requests, and also handles communication with the users.” Service desks such as JIRA, Autotask and ServiceNow, often also support multiple IT Service Management (ITSM) activities.
10 Popular Alternatives to AppDynamics
Application performance is one of the most important factors in determining your brand reputation, revenue, and authenticity in the virtual marketplace. There are several ways to monitor your application’s health and performance. Some choose to do it the traditional way - manually. Others prefer to adopt an automated solution capable of monitoring an application 24/7 and producing useful visualizations all by itself.
7 Steps to Strengthen Your Security Posture
Learn more about your security posture and why it matters. Assess and strengthen your IT security posture with these critical steps.
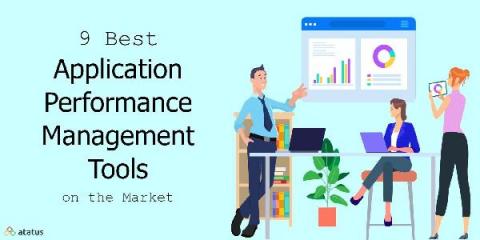
9 Best Application Performance Monitoring Tools on the Market and Why Should You Use One
The Application Performance Monitoring (APM) tools make managing your applications simple and easy, ensuring that your business software performs at its best. It's one thing to keep track of IT infrastructure and networks, but it's frequently the applications that demand the greatest care. It's not just the fact that there could be a lot of them; it's also the fact that they tend to update regularly, which can lead to software conflicts and unexpected hardware issues.
Embedded Analytics for IT
When we hear the term ‘embedded analytics’, most people think of business intelligence. The concept of embedded analytics refers to the integration of analytic content and capabilities within a business process application. The business benefits of embedding analytics into a business process include increased visibility, more effective strategic planning and accelerated time to value.
How to Monitor Full-Stack Django Applications
Tip of the Month: BiQ Release Validation
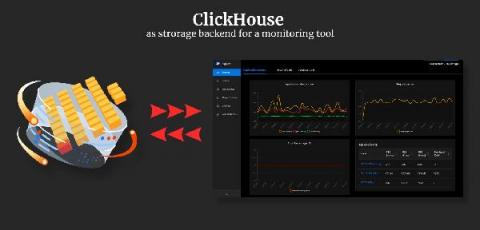
Launching support for ClickHouse as storage backend for SigNoz
In this article, we dig deeper into why we decided to extend support for ClickHouse as a storage backend for SigNoz and the efficiency gains we achieved using it.
AIOps Strategy and Management
In an earlier blog, I provided an introduction to AIOps. AIOps is the application of Artificial Intelligence to IT Operations. Many people misunderstand AIOps as replacing or mimicking human intelligence. This is not what AIOps is about. Rather, AIOps seeks to apply algorithms to solve specific problems, often much faster, much more accurately, and at much higher scale than a human ever could solve the problem.
Autoscaling AppOptics With Apache Deployed in K8s Pods
AIOps 101
In all internal and external conversations that I’ve had in the recent weeks, almost always the discussion veers towards AIOps. This blog summarizes research that I’ve done into understanding AIOps – what it is, why analysts and customers are so interested in this technology and what are some of the benefits that it offers.
Top 7 AppDynamics Competitors and Alternatives to Try in 2021
AppDynamics was founded by Jyoti Bansal in 2008. It is an application performance management (APM) and IT operations analytics (ITOA) company that focuses on managing application performance and availability in a cloud computing environment and inside the data centre.
Datadog on Chaos Engineering
Azure Monitor for Windows Virtual Desktop (WVD)
At the end of March 2021, Microsoft released Azure Monitor for Windows Virtual Desktop (WVD) for General Availability. Built upon Azure Monitor Workbooks to give insights into the Windows Virtual Desktop environment, including: Connection Diagnostics, Connection Performance, Host Diagnostics, Host Performance, Utilizations, Users, Clients and Alerts.
Best 7 Monitoring Tools for Node.js Application
Sometimes, applications do not perform as well as they should. Application developers are responsible for performing preventive and curative maintenance. Customers that use your application as a developer may waste a lot of money attempting to restore the applications without your help. To maintain track of your application's activities, it's best to use an effective monitoring system. Monitoring a Node.js application entails keeping a careful eye on its performance and availability.
New Relic vs Atatus
Application Performance Monitoring (APM) is used to ensure consistent availability, performance, and response times of an application. Websites, mobile applications, and business applications have use cases for monitoring purposes. Although, in the digital world, monitoring use cases expand to the processes, hosts, logs, networks, and end-users including your customers and employees.
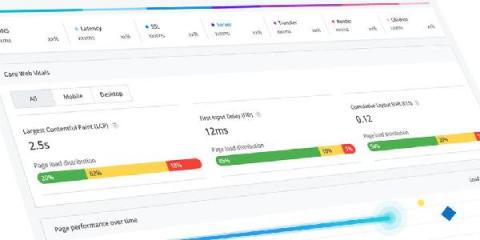
Introducing native support for Core Web Vitals
In December last year, we released tracking for Core Web Vitals using custom tagging so that you can have consolidated performance metrics that accurately reflect your customer's digital experience. Today, we are excited to continue this journey and announce our native first-class support for Core Web Vitals (CWV) tracking within Real User Monitoring. Now, you can see a detailed overview of how your website performs against Google's modern user-centric metrics, alongside all the diagnostics you need to take action.
Our first community update - Signal #01
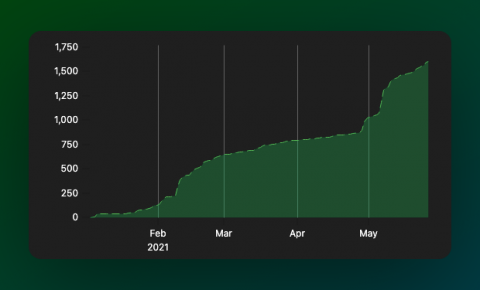
Excited to launch our first newsletter. We are delighted to have crossed 1.6k stars on GitHub, growing more than 30% last month. Catch up on what we're upto at SigNoz!
This Month in Datadog: May 2021 (Episode 1)
That One Time Using APM Bit Us
At Catchpoint, our mission is to provide customers with actionable data that will help them reduce MTTR and maintain a positive digital experience. We measure "from where the users are" to ensure the data reflects real end-user experience. As someone that's part of the Catchpoint on-call chain, this is extremely important to me. I do not want to be woken up at 2 AM because a server is misbehaving, only to find out that the application failed over gracefully and no users were impacted.


