Operations | Monitoring | ITSM | DevOps | Cloud
July 2021
Spring Boot - Monitor your application with OpenTelemetry & SigNoz
8 Key AIOps Capabilities in eG Enterprise Make Monitoring Proactive and Efficient
As we indicated in our previous blog, AIOps (Artificial Intelligence for IT Operations) refers to the application of machine learning analytics technology that enhance IT operations analytics.
This Month in Datadog: July 2021 (Episode 3)
IT Remote Monitoring Software
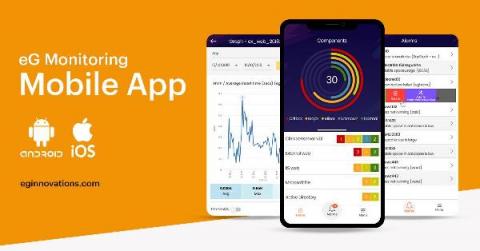
I’ve recently been talking to some of the users of our eG Enterprise monitoring solution and its AIOps-powered root cause analysis platform. Multiple users have mentioned how the usability of the solution has been enhanced considerably by the availability of rich featured mobile apps for iOS and Android platforms.
Scout APM Announces Python Application Support for Error Monitoring Tool
Traditionally an APM tool, Scout has expanded its service offerings to now include error monitoring of Python web applications for more cohesive and actionable observability insights within a single platform. This new feature supports an overall better user experience by eliminating the need for multiple web-application monitoring services; Scout APM with Scout Error Monitoring offers performance and error insight and alerting within a single, integrated dashboard.
The New Normal for Hybrid IT Solutions
PD Summit21: ScoutAPM: DevOps: Philosophy vs. Practice
Detect any issue with Splunk APM before it turns into a customer problem
Citrix Tips for Troubleshooting
I recently saw a user asking on EUC Slack “is there a Domain controller response time in
Latest Cisco AppDynamics App Attention Index Reveals Brands Have Only One Shot to Win Over Customers
The App Attention Index 2021: Who takes the rap for the app?
Explore the latest trends in global consumer attitudes, behavior and expectations for digital services based on interviews with more than 13,000 consumers.
The Secret to a Successful Hybrid Application Migration
Best Practices for Infrastructure Management and Monitoring
The Secret to a Successful Hybrid Application Migration
Tip of the Month: Reducing Noise Alerts
Code-Free Synthetic Monitoring
Partner Speak: Why Atos chose eG Innovations to proactively monitor its customers' virtual workspaces
Atos needed deep insights into the entire chain of components necessary for a virtual workplace to do its job properly, with a particular emphasis on user experience. This is exactly the kind of requirement that eG Enterprise is built for, which is what prompted Atos to start using the product five years ago. Sietze Vrind, a business manager at Atos says they’ve “never regretted it for a moment.”
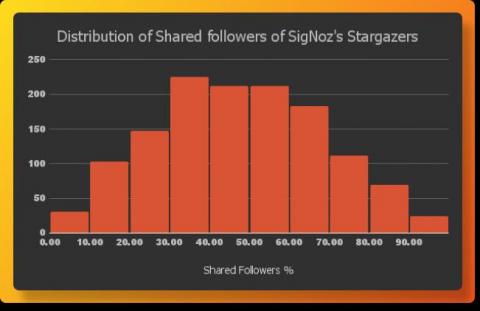
Getting to know our 4000+ stargazers on GitHub
In a little over 4 months, we have crossed 4k+ stars on our GitHub repo. In this article, we explore what we can learn from our GitHub stars.
Understanding and Debugging Applications Using the Service Map
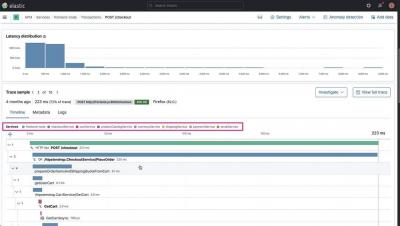
Understanding and Debugging Applications Using Traces
Monitor containerized ASP.NET Core applications with Datadog APM
ASP.NET Core is an open source web development framework that enables you to develop .NET applications on macOS, Linux, and Windows machines. The introduction of .NET Core in 2016 dramatically increased the number of ways to build and deploy .NET applications. This means that you need the ability to easily monitor application performance across a wide variety of platforms, such as Docker containers.
Launched ClickHouse support, crossed 4k stars on GitHub -Signal #02
It's time for community updates #2. We're delighted to announce that SigNoz is now live with ClickHouse support. And yeah, we trended on GitHub at No.1 🎉
The Reviews Are In-SolarWinds AppOptics Is Top Rated From TrustRadius
End-to-End Monitoring of Citrix Infrastructures: FAQs
The webinar included a live demonstration of how our eG Enterprise solution provides an end-to-end view of the Citrix deployment including the Citrix ADCs, Delivery Controllers, License servers, Virtual App servers, Virtual Desktops, and other Citrix tiers including WEM, AppLayering, and others. Citrix Cloud is also supported.
Application Lifecycle Management: A Comprehensive Guide
Discipline is the key to success for all companies doing well in their field or reaching a trillion-dollar valuation. They manage the software and update it very frequently when it comes to providing services. So how are they able to manage it and keep their software updated every moment? The answer is ALM—Application Lifecycle Management. ALM includes the people, the software, the tools, and the processes included in software development, from planning to deploying it for end customers.
Distributed Tracing for Kafka Clients with OpenTelemetry and Splunk APM
This blog series is focused on observability into Kafka based applications. In the previous blogs, we discussed the key performance metrics to monitor different Kafka components in "Monitoring Kafka Performance with Splunk" and how to collect performance metrics using OpenTelemetry in "Collecting Kafka Performance Metrics with OpenTelemetry." In this blog, we'll cover how to enable distributed tracing for Kafka clients with OpenTelemetry and Splunk APM.


