Operations | Monitoring | ITSM | DevOps | Cloud

September 2023

This Month in Datadog: Integrations for AI/LLM Tech Stacks, Serverless Monitoring Releases, and more

Datadog is constantly elevating the approach to cloud monitoring and security. This Month in Datadog updates you on our newest product features, announcements, resources, and events. This month, we put the Spotlight on a trio of serverless monitoring releases..

APM Today: Application Performance Monitoring Explained

Application Performance Monitoring (APM) is a technology approach that provides real-time information about how your software applications are performing. With a comprehensive view into application health and availability, APM can do things like: Both the importance and the usage of APM has grown in recent years. That’s because companies rely on increasingly complex applications to run their businesses. Here is what you need to know about Application Performance Monitoring.

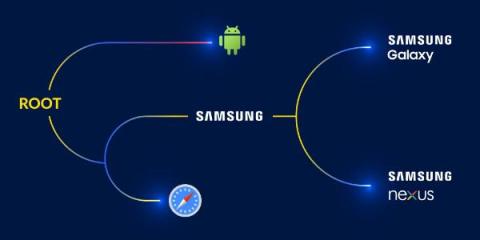
Understanding Mobile User Journeys

Ensure each user has the best and most optimal mobile experience possible by understanding mobile user journeys. Bring teams together to understand how a user interacts with the mobile application in order to streamline operations and improve their experience. By leveraging data collectors, teams can gain an even deeper understanding of specific items in a shopping cart that was lost, for example, and their associated revenue. This information helps build a conversion chart giving the business an indication of how severe the problem may be to then help prioritize remediation efforts.

What is Shadow IT? Will AI make this more challenging?

Shadow IT is a term used to describe IT systems, applications, or services that are used within an organization without the explicit approval, knowledge, or oversight of the IT department or the organization’s management. It typically arises when employees or departments adopt and use software, hardware, or cloud services for their specific needs without going through the official IT procurement or security processes.

OpenTelemetry Webinar: What is the OpenTelemetry API

The next in our series on OpenTelemetry fundamentals, this video is all about the #opentelemetry API, a part of the larger #cncf project to bring open standards to telemetry measuring, monitoring, and reporting. More about SigNoz: SigNoz - Monitor your applications and troubleshoot problems in your deployed applications, an open-source alternative to DataDog, New Relic, etc. Backed by Y Combinator.

Can you have a career in Node without knowing Observability?

”Isn’t Observability something for Ops to worry about?” I’ve heard this response more than once when talking about how developers should learn OpenTelemetry. I wanted to write this piece to show you how important and how easy it is to learn observability from day one as a coder.

Adding a CDN to a load balancer (for a much faster website)

Here at Raygun, we like to go fast. Really fast. That’s what we do! When we see something that isn’t zooming, we try to figure out how to make it go faster. So today, we’re answering a simple (and relevant) question; how do we make our public site, raygun.com, much, much faster? The answer, at first glance, is simple—we build it into a Content Delivery Network (CDN).

Why You Need An Application Performance Monitoring Tool

As organisations strive to deliver seamless user experiences, maximise operational efficiency, and maintain a competitive edge, the need for comprehensive Application Performance Monitoring (APM) tools becomes increasingly evident. APM tools offer invaluable insights into the performance and behaviour of applications in real-time. They go further than the conventional monitoring approach by providing a holistic view of the entire stack, encompassing servers, databases and user interactions.

Understanding OpenTelemetry Spans in Detail

Debugging errors in distributed systems can be a challenging task, as it involves tracing the flow of operations across numerous microservices. This complexity often leads to difficulties in pinpointing the root cause of performance issues or errors. OpenTelemetry provides instrumentation libraries in most programming languages for tracing.

Best Practises For Application Performance Monitoring

Application performance monitoring (APM) tools have become a fundamental part of many organisations that wish to track and observe the optimal functioning of their web-based applications. These tools serve to greatly simplify the process through automation and allow teams to effectively collaborate to maximize efficiency, enabling you to reach the root cause of an issue before it reaches your customers.

Using data collectors to compare a new feature

Leverage AppDynamics analytics to determine how a new feature introduced within an application proves to be an improvement or degradation. By creating and leveraging data collectors to look for a specific flag in a release, a new parameter or attribute, that indicates whether a feature is enabled, one can quickly gain insights as to whether there has been a performance improvement.

The hidden impact of cache locality on application performance

My favorite technical experience from grad school was all the cool ways we were trying to squeeze every last bit of performance out of the IBM JVM (now called Eclipse OMR). The majority of such optimizations required an intricate understanding of how CPUs and memories look under the hood. But why is there such an impressive performance gain in padding objects with blank space to the closest multiple of 64 bytes and ensuring they always start at addresses that are exactly divisible with 64?

Top 11 Loki alternatives in 2023

Loki is a open source log aggregation tool developed by Grafana labs. It is inspired by Prometheus and is designed to be cost-effective and easy to operate. But Loki also has some limitations, and you might want to explore some Loki alternatives for your log analytics. In this article, we will look at 11 log management tools you can use as a Loki alternative. Loki is designed to keep indexing low. It does this by making use of labels.

Comparing Datadog and New Relic's support for OpenTelemetry data

OpenTelemetry is the future of Observability, APM, Monitoring, whatever you want to call ‘the process of knowing what our software is doing.’ It’s becoming common knowledge that your time is better spent gaining experience with an open, standardized system for telemetry than closed-source or otherwise proprietary standard. This truth is so universally acknowledged that all the big players in the market have made announcements of how they’re embracing OpenTelemetry.

Identifying memory leaks with automatic leak detection

Proactively identify memory leaks that occur in production environments that cause performance issues by using Automatic Leak Detection. See how automated capabilities can assist teams with detecting and diagnosing these types of common issues before the application performance or customer experience is impacted, adversely affecting the business.

OpenTelemetry Webinar: What *is* the OpenTelemetry API?

We've all read “OpenTelemetry is a collection of APIs, SDKs, and tools.” Okay, great, but which parts are APIs, what's the SDK, and which are the tools? And aren't there supposed to be some standards in there too? Join Nica and Srikanth Chekuri as we explore the OpenTelemetry API and how it fits into your Observability process.

Cisco Secure Application Delivers Business Risk Observability for Cloud Native Applications

Built on Cisco's Full-Stack Observability Platform, Cisco Secure Application provides organisations with intelligent business risk insights to help them better prioritise issues, respond in real-time to revenue-impacting security risks and reduce overall organisational risk profiles.

Troubleshooting Spring Boot Microservices - A Real World Case Study

Today, I’ll cover Shift Left Monitoring: A Pathway to Optimized Cloud Applications and how left-shifted troubleshooting of Spring Boot code issues using observability tooling can avoid production issues, unnecessary costs and improve product quality. Shift-left is an approach to software development and operations that emphasizes testing, monitoring, and automation earlier in the software development lifecycle.

Bi-directional Integration of Cisco AppDynamics and Cisco ThousandEyes

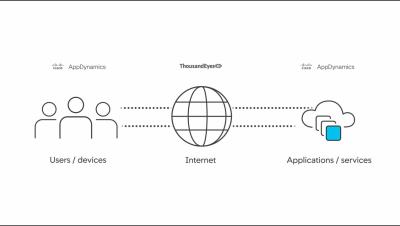
Get full visibility into every facet of your customer's digital experience What if you could see everything that impacts your digital supply chain—from the code to the infrastructure to the network and everything in between? With AppDynamics plus ThousandEyes - you can.

Sending and Filtering Python Logs with OpenTelemetry

While support for logging in the OpenTelemetry Python project is listed as 'experimental,' it's completely possible to send logs from your Python application. The Opentelemetry Collector has support for numerous existing logging systems, effectively exporting log data from wherever you were sending logs currently; you can also use the filelog receiver to tail and send logs from files. The only 'experimental' portion of the Python SDK is sending logs directly from code-level instrumentation.

14,000+ GitHub stars, 4 Million Docker Downloads, in-context Logs and a Team Workation - SigNal 28

Welcome to the 28th edition of our monthly product newsletter - SigNal 28! Our team shipped many features and improvements last month. We also had an amazing team workation in Goa, India. Let’s dive in to see what humans at SigNoz were up to in the month of August 2023.

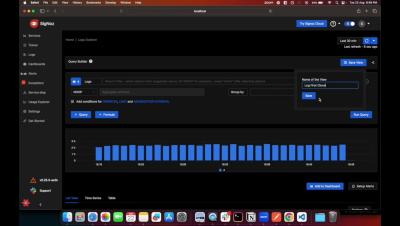
Save View in Explorer Pages

More about SigNoz: SigNoz - Monitor your applications and troubleshoot problems in your deployed applications, an open-source alternative to DataDog, New Relic, etc. Backed by Y Combinator. SigNoz helps developers monitor applications and troubleshoot problems in their deployed applications. SigNoz uses distributed tracing to gain visibility into your software stack. If you need any clarification or find something missing, feel free to raise a GitHub issue with the label documentation or reach out to us at the community slack channel.
Sponsored Post

Part one: 7 must-know object-oriented software patterns (and their pitfalls)

Object-oriented (not orientated!) design is a fundamental principle of modern software engineering, a crucial concept that every developer needs to understand and employ effectively. Software design patterns like object-oriented design serve as universal solutions to common problems, across a range of instances and domains. As software engineers advance in their careers, they actually often start using these patterns instinctively, even without knowing it.