Operations | Monitoring | ITSM | DevOps | Cloud
April 2021
Explainer Video: Splunk for Infrastructure Monitoring and Troubleshooting
End-to-End Observability Drives Great Digital Experiences
Keeping Watch Over Microservices and Containers
Under the Hood With Splunk Observability
Key Kubernetes Metrics and Resources to Monitor for Peak Cluster Performance
Monitoring is not easy. Period. In our guide to Kubernetes monitoring we explained how you need a different approach to monitoring Kubernetes than with traditional VMs. In this blog post, we’ll go into more detail about the key Kubernetes metrics you have access to and how to make sense of them. Kubernetes is the most popular container orchestrator currently available. It’s available as a service across all major cloud providers. Kubernetes is now a household name.
Logz.io and the AWS Distro for OpenTelemetry
Amazon Web Services has announced enhanced support for the open-source distribution of the OpenTelemetry project for its users. AWS Distro for OpenTelemetry (ADOT) now includes support for AWS Lambda layers for the most popular languages and additional partners integrated into the ADOT collector. And one of those partners is Logz.io! Logz.io is happy to announce that our exporter is now included in the AWS Distro for OpenTelemetry.
How to Improve Kubernetes Management and Administration with LogDNA
The essentials of central log collection with WEF and WEC
Last week we covered the essentials of event logging: Ensuring that all your systems are writing logs about the important events or activities occurring on them. This week we will cover the essentials of centrally collecting these Event Logs on a Window Event Collector (WEC) server, which then forwards all logs to Elastic Security.
Using Coralogix to Gain Insights From Your FortiGate Logs
FortiGate, a next-generation firewall from IT Cyber Security leaders Fortinet, provides the ultimate threat protection for businesses of all sizes. FortiGate helps you understand what is happening on your network, and informs you about certain network activities, such as the detection of a virus, a visit to an invalid website, an intrusion, a failed login attempt, and myriad others. This post will show you how Coralogix can provide analytics and insights for your FortiGate logs.
Searching through logs with the free and open Logs app in Kibana
Log exploration and analysis is a key step in troubleshooting performance issues in IT environments — from understanding application slow downs to investigating misbehaving containers. Did you get an alert that heap usage is spiking on a specific server? A quick search of the logs filtered from that host shows that cache misses started around the same time as the initial spike.
Centralized Log Management for Multi-Cloud Strategies
The future of enterprise IT stacks is the cloud. In fact, according to a 2019 Gartner post, when we say “cloud infrastructure,” 81% of people really mean multi-cloud. Considering the analyst took this survey prior to the pandemic, we can safely assume that the number of companies with multi-cloud stacks is probably higher than this. Companies choose a multi-cloud strategy for a lot of reasons, including making disaster recovery and migration easier.
9 Best Cloud Logging Services for Log Management, Analysis, Monitoring & More [2021 Comparison]
Log management stopped being a very simple operation quite some time ago. Long gone are the “good old days” when you could log into the machine, check the logs, and grep for the interesting parts. Right now things are better. With the observability tools that are now a part of our everyday lives, we can easily troubleshoot without the need to connect to servers at all. With the right tools, we can even predict potential issues and be alerted at the same time an incident happens.
Elastic and Alibaba Cloud: Reflecting on our partnership and looking to the future
Alibaba Cloud is an important partner to us here at Elastic. We officially started our collaboration and strategic partnership with Alibaba Cloud back in 2017, when we announced the Alibaba Cloud Elasticsearch service. Since then, we’ve seen rapid adoption and growth of the service, which now supports more than 10 petabytes of data.
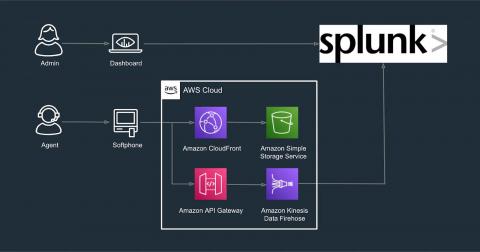
Splunk App for Amazon Connect: End-to-End(point) Visibility for an Optimal Customer Experience
How do you ensure a customer experience (CX) that leaves both participants of a conversation not just satisfied, but elated afterwards? And how do you do that, thousands of times over the course of a day and millions of times a year?
Splunk and Zscaler Utilize Data and Zero Trust to Eradicate Threats
The past year has challenged us in unimaginable ways. We kept our distance for the greater good, while companies faced the daunting task of transforming their workforce from in-person to remote — practically overnight. This presented a unique challenge for cybersecurity teams. How would they ensure employees retained access to critical data in a secure way? Working in the cloud has made remote work easier for many organizations, but has also presented new risks.
Can I Send an Alert to Discord?
This is a great question. The answer is yes. You can send Graylog alerts via email, text, or Slack, and now Discord. Yes Discord! The growth and use of Discord has transformed from just many Gaming users to businesses using it as a communication platform. Many businesses like: Gaming Developers, Publishers, Journalists, Community and Event Organizers use Discord. Discord lets Gamer Developers work in teams with each other on their projects.
How to Build a Scalable Prometheus Architecture
When building distributed, scalable cloud-native apps containing dozens or even hundreds of microservices, you need reliable monitoring and alerting. If you’re monitoring cloud-native apps in 2021, there’s a good chance you’ve chosen Prometheus. Prometheus is an excellent choice for monitoring containerized microservices and the infrastructure that runs them — often Kubernetes.
Dynamic Observability: Troubleshooting Techniques for 2021
The essentials of Windows event logging
One of the most prevalent log sources in many enterprises is Windows Event Logs. Being able to collect and process these logs has a huge impact on the effectiveness of any cybersecurity team. In this multi-part blog series, we will be looking at all things related to Windows Event Logs. We will begin our journey with audit policies and generating event logs, then move through collecting and analysing logs, and finally to building use cases such as detection rules, reports, and more.
How to Plan a Threat Hunt: Using Log Analytics to Manage Data in Depth
Export API v2 - Streamline Large Log Data Exports
The LogDNA platform improves how teams use logs to help with debugging and troubleshooting. However, having fast access to actionable data isn’t the only value you can get from logs. There’s a lot of additional value in analyzing historical log data to understand long term trends. For example, customers can use log data as a way to represent audit events for user actions and benefit from visualizing them in a 3rd party software.
How to Test Website Speed: A Step by Step Tutorial on Measuring Page Load Times the Right Way
It shouldn’t come as a surprise that website speed is important to your viewers. It’s the first thing they experience after accessing your website. Your website speed is like an unsung hero that you don’t really notice when it works the way it should, but the second it doesn’t live up to the expectations of your users, they will immediately notice it.
Audit logs in Site24x7
Full-stack monitoring for code-to-cloud visibility
The 7 Hues of DevOps
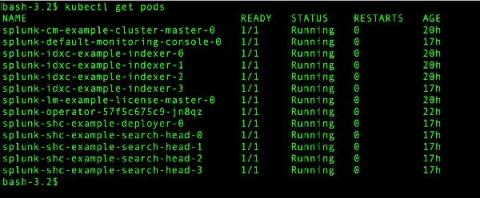
Going Live: Splunk Operator for Kubernetes 1.0.0
With everything going on in the world, it seems like a lifetime ago that we started talking about the Splunk Operator for Kubernetes, which enables customers to easily deploy, scale, and manage Splunk Enterprise on their choice of cloud environment. During that time, we’ve heard from an increasing number of on-premise and public cloud Bring-Your-Own-License Splunk customers that containerization and Kubernetes are an important part of their current and future deployment plans.
Monitoring Pulse Connect Secure With Splunk (CISA Emergency Directive 21-03)
To immediately see how to find potential vulnerabilities or exploits in your Pulse Connect Secure appliance, skip down to the "Identifying, Monitoring and Hunting with Splunk" section. Otherwise, read on for a quick breakdown of what happened, how to detect it, and MITRE ATT&CK mappings.
Root Cause Analysis in IT: Collaborating to Improve Availability
The shift to remote work changed the way IT teams collaborate. Instead of walking over to a colleague’s desk, co-workers collaborate digitally. Looking forward, many companies will continue some form of remote work by taking a hybrid approach. Root cause analysis in IT will always require collaboration as teams look to improve service availability and prevent problems. Sitting in front of the same screen and looking at the same data makes it easy to discuss problems.
NGINX Ingress Controller Template
We set out with a plan this year to nurture and grow our developer ecosystem. In 2020, we launched our Template Library to empower joint users of LogDNA and our partners to have an out-of-the-box logging experience from every layer of their stack. As the use of these templates has grown, users have told us that they save them time from manually creating Views, Boards, and Screens, and helps them gain insight from their logs much quicker.
Using Coralogix + StackPulse to Automatically Enrich Alerts and Manage Incidents
Keeping digital services reliable is more important than ever. When something goes wrong in production, on-call teams face significant pressure to identify and resolve the incident quickly – in order to keep customers happy. But it can be difficult to get the right signals to the right person in a timely fashion.
Log Shipping Using Fluent Bit and vSphere with Tanzu
One of the new features that came with the latest update of vSphere with Tanzu was the ability to use TKG Extensions. This powerful framework allows simplified deployment and management of multiple open source projects that are backed by VMware support, including alerting with Prometheus, visualization with Grafana, ingress with Contour, and logging with Fluent Bit.
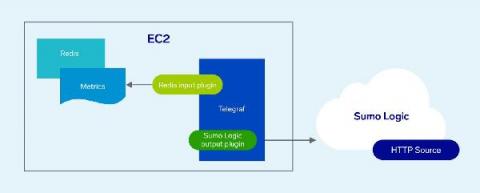
Using Telegraf to Collect Infrastructure Performance Metrics
[Webinar] The role of log management in aiding observability in distributed systems
Logz.io Named a Leader in GigaOm Radar for Cloud Observability
Today we are excited to share a key milestone, not only for Logz.io, but also for our industry as a whole. For the first time ever, an industry analyst took on the ambitious challenge of analyzing and assessing several different markets including monitoring and telemetry, APM, AIOps, observability, and more. The radar also takes account of evaluating leaders’ various products, unveiling a comprehensive overview under the unified lens of Observability.
Up Close Monitoring with SignalFlow
It’s April, and that means it’s Mathematics and Statistic Awareness month. And in our everyday world of monitoring and observability, both play an ever-increasing role in how we keep track of our environments, both our apps and our infrastructure. Our world is no longer about just pinging the server/app to make sure “It’s alive!”.
Troubleshooting Firewall Issues in DigitalOcean
Up Close Monitoring with AWS Fargate
On our cloud-native journey, we live in a containerized world. Our environments are containers, managed by orchestrators, and living on some level of computing clusters. Of course, that means you are also responsible for managing all those bits, right?
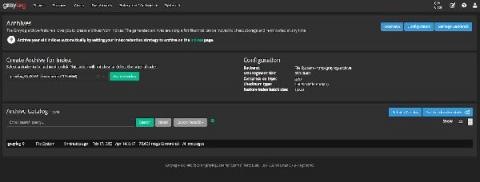
How Does Archiving Work in Graylog?
Every week we get many great questions through support, the community, social media, and our weekly demo. On Fridays, I like to share the most common questions and answers, tips, insights, a closer look at Graylog, interviews, etc. If you have any questions for me, drop them on Twitter, and I’ll do my best to fold them into upcoming Friday posts. Our handle is @graylog2.
Logit.io Announce Platform Support For Open Distro For Elasticsearch
Software Development Optimization in Jira Cloud
Software Development Optimization for Atlassian
Building Kibana dashboards more efficiently
Creating dashboards is quicker and easier than before with a new streamlined navigation experience, now available in Kibana 7.12. This dashboard-first approach makes it simple for you to create and add visualizations without leaving your dashboard-building flow. Get started directly from a Kibana dashboard with a few simple steps: Select Create Panel and choose what type of visual you want to build.
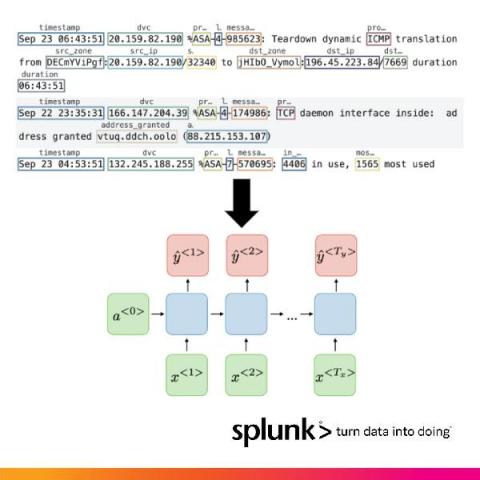
How Splunk Is Parsing Machine Logs With Machine Learning On NVIDIA's Triton and Morpheus
Large amounts of data no longer reside within siloed applications. A global workforce, combined with the growing need for data, is driving an increasingly distributed and complex attack surface that needs to be protected. Sophisticated cyberattacks can easily hide inside this data-centric world, making traditional perimeter-only security models obsolete.
Logit.io's Response To The Elasticsearch B.V. SSPL Licensing Change
On the 14th of January 2021, Elasticsearch B.V. announced that future releases of Elasticsearch and Kibana would be released under a dual license SSPL (Server Side Public License). As a result of this change it is evident that the components that make up Elasticsearch and Kibana in version 7.11 (and onwards) of the ELK Stack will no longer be considered as open source based upon the Open Source Initiative's requirements for licensing.
6 Data Cleansing Strategies For Your Organization
Profiles in Open Source: Dana Fridman & Contributing as a Product Designer
Dana Fridman is a design guru. Her contributions to UX at Logz.io are unmatched, and her input on upcoming updates to our app’s UI will be an achievement. But her portfolio is getting more than just Logz.io projects right now. As part of her work here, she is also making her mark on Jaeger. You see, Dana is the major design contributor to the open source Jaeger project. Open source contributions tend to be backend-focused and the domain of developers.
How to Collect and Visualize Windows Events From 5 Hosts in 5 Minutes
If you’re investigating incidents on your Windows hosts, sifting through the Event Viewer can be a painful experience. It’s best to collect and ship Windows Events to a separate backend for easier visualization and analysis – but depending on the solution you choose, this can take some significant legwork. Often, this can require manually configuring a 3rd party tool or agent, just to get started.
Endpoint Security Data Collection Strategy: Splunk UF, uberAgent, or Sysmon?
Many threats originate from the endpoint and detecting them requires insights into what happens on the endpoint. In this post we look at different endpoint activity data sources, comparing the benefits and capabilities of Splunk Universal Forwarder with vast limits uberAgent and homegrown solutions.
Web Assembly Deep Dive - How it Works, And Is It The Future?
You’ve most likely heard of Web Assembly. Maybe you’ve heard about how game-changing of a technology it is, and maybe you’ve heard about how it’s going to change the web. Is it true? The answer to this question is not as simple as a yes or no, but we can definitely tell a lot as it’s been around for a while now. Since November 2017, Web Assembly has been supported in all major browsers, and even mobile web browsers for iOS and Android.
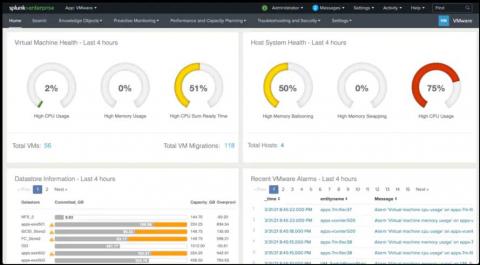
Monitor and Troubleshoot VMware Infrastructure with Splunk
Splunkbase apps are very popular among IT administrators and provide out-of-the-box content for different infrastructure types such as Windows, Unix, VMware, and AWS. As customers expanded their need for more infrastructure types, they historically had to manage and leverage multiple apps.
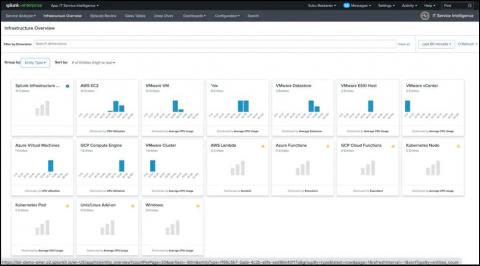
Splunk IT Essentials Work: A Centralized App for All Things ITOps
Splunkbase apps are very popular among IT administrators and provide out-of-the-box content for different infrastructure types such as Windows, Unix, VMware, and AWS. As customers expanded their need for more infrastructure types, they historically had to manage and leverage multiple apps. We have now introduced IT Essentials Work, one centralized app that provides a simpler way to monitor and troubleshoot across different infrastructure types without having to install and maintain different apps.
The Hidden Costs of Your ELK Stack [VIDEO]
Tutorial: Set Up a Linux Source
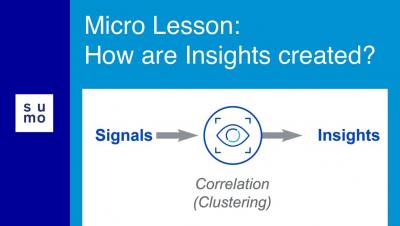
Microlesson: How are Insights Created?
Troubleshooting Firewall Issues in DigitalOcean
How Can I Silence Alerts?
Yes, there is the ability to silence or disable alerts in Graylog. There are times in IT environments where you know you are going to generate specific events in your network. As an example, you are patching servers, upgrading hardware components, and many other things. These types of activities are very common during maintenance windows.
Logz.io Debuts Multiple Tracing Accounts and Jaeger Architecture Visualization
Logz.io has pressed hard to align our tracing and metrics analytics capabilities over the past year. And as our technology advances, so does our service. We are announcing Multiple Tracing Accounts with Logz.io Distributed Tracing, aligning it with our logging and metrics tools. Complementing multiple data sources for metrics and logs, Logz users can segment their data according to sources and teams for better organization.
What You Need to Know About Logz io's Prometheus as a Service
Improve Monitoring and Observability With The Catchpoint and Sumo Logic Integration
Sumo Logic is a cloud-based log management and analytics service that leverages machine-generated big data to deliver real-time IT insights. We’re excited to share that you can now easily integrate Catchpoint and Sumo Logic, giving you a number of fantastic benefits. The integration involves pushing data from Catchpoint to Sumo Logic using Webhooks and then query the data to build visualizations. Why do we use Webhooks?
Elastic and Confluent partner to deliver an enhanced Kafka + Elasticsearch experience
Today, we are pleased to announce a partnership with Confluent to jointly develop and deliver an enhanced product experience to the Kafka-Elasticsearch community. Kafka is — and has been since the very early days — an important component of the Elastic ecosystem.
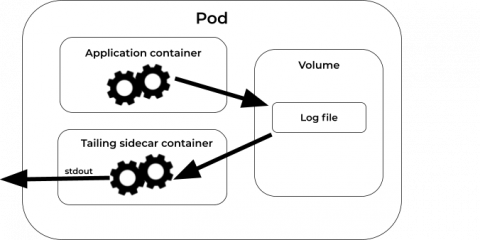
Tail your logs with Tailing Sidecar Operator
Advanced Link Analysis: Part 2 - Implementing Link Analysis
Link analysis, which is a data analysis approach used to discover relationships and connections between data elements and entities, has many use cases including cybersecurity, fraud analytics, crime investigations, and finance. In my last post, "Advanced Link Analysis: Part 1 - Solving the Challenge of Information Density," I covered how advanced link analysis can be used to solve the challenge of information density.
Best Practices For Logging In AWS Lambda
Today, we’ll cover some of the ways you might find quite useful in your everyday work. We’ll go through some of the logging best practices in AWS Lambda, and we will explain how and why these ways will simplify your AWS Lambda logging. For more information about similar topics, be sure to visit our blog. Let’s start with the basics (and if you have the basics covered, feel free to skip ahead): How does logging work with AWS Lambda?
Threat Hunting with Threat Intelligence
With more people working from home, the threat landscape continues to change. Things change daily, and cybersecurity staff needs to change with them to protect information. Threat hunting techniques for an evolving landscape need to tie risk together with log data. Within your environment, there are a few things that you can do to prepare for effective threat hunting. Although none of these is a silver bullet, they can get you better prepared to investigate an alert.
How to Monitor RabbitMQ Performance: Tools & Metrics You Should Know About
Nowadays, most applications we build are composed of microservices and distributed in nature. In such a setup, communication between these microservices is crucial, but can, unfortunately, cause some headaches. The first thing I check when I’m troubleshooting a bug in production is inter-service communication. Having a reliable tool at your disposal to take care of this can reduce a lot of stress. RabbitMQ, a hybrid messaging broker, is one such tool.
Kubernetes Logging Simplified - Pt 2: Kubernetes Events
In my first post in the Kubernetes Logging Simplified blog series, I touched on some of the ‘need to know’ concepts and architectures to effectively manage your application logs in Kubernetes – providing steps on how to implement a Cluster-level logging solution to debug and analyze your application workloads. In my second post, I’m going to touch on another signal to keep an eye on: Kubernetes events.
Tutorial: Setting up NGINX for non-Kubernetes Sources
Splunk Developer Spring 2021 Update
The cold season is hopefully coming to an end, and Spring is here! And just like the changes in the seasons, we have a new SDK release, updated developer docs, and other signs of new growth! It’s a great time to update your apps using the latest SDKs for the latest Splunk Cloud and Splunk Enterprise releases. Plant your session proposal in the .conf21 Call For Speakers! It's also time to prune away some older jQuery and Python versions support. Read on for the latest news.
Interview With Cyber Security Author Scott Steinburg
For our first specialist interview on the Logit.io blog, we’ve welcomed Scott Steinburg to share his thoughts on the current state of cybersecurity as well as the reasons behind writing his new book Cybersecurity: The Expert Guide. Scott is the creator of the popular Business Expert’s Guidebook series, host of video show Business Expert: Small Business Hints, Tips and Advice and CEO of high-tech consulting firm TechSavvy Global.
AWS Monitoring Challenges: Avoiding a Rube Goldberg Approach to AWS Management [VIDEO]
Web Server Monitoring Your Application on Nginx with Logz.io
A big topic of interest nowadays is web application monitoring. Application performance monitoring and log analytics are required by businesses of all sizes to ensure their web applications’ smooth operation. If your application serves as the backend for your business processes, it is critical for your organization. You need to know, in real-time, when and why it breaks. To answer these questions, we will use Logz.io products to monitor a simple web application served by Nginx.
Analyze your GKE and GCE logging usage data easier with new dashboards
System and application logs provide crucial data for operators and developers to troubleshoot and keep applications healthy. Google Cloud automatically captures log data for its services and makes it available in Cloud Logging and Cloud Monitoring. As you add more services to your fleet, tasks such as determining a budget for storing logs data and performing granular cross-project analysis can become challenging.
Explore NGINX usage, performance, and transactions to increase customer experience
What Should You Do When You Receive Event Log Monitor Alerts?
When you are installing PA Server Monitor, you will need to configure what occurs when there are event log monitor alerts. You typically set this up during the initial install. However, it is not uncommon to want to make changes and updates or even add new events to your server monitoring software as you become more familiar with it.


