Operations | Monitoring | ITSM | DevOps | Cloud
June 2021
FierceTelecom FIBER TECHNOLOGIES STRATEGIES
How to Connect With Other Community Members on THWACK
User Identity Awareness with LoadMaster ESP and Flowmon
In one of the previous blog posts from the load balancing education series, we discussed the Edge Security Pack functionality to provide an additional layer of security in front of an application workload to ensure that only properly authenticated users can interact with the application. In this role, the LoadMaster acts as a gateway for the application and handles user authentication through a third-party identity provider such as Microsoft Active Directory.
Flexmls® Drops Imperva for HAProxy Enterprise's Bot Management Capabilities
FBS is the leading innovator of Multiple Listing Service (MLS) technology and one of the most recognized and respected real estate industry software brands. Fargo, ND-based and 100% employee-owned, FBS is dedicated to providing powerful and innovative products with responsive, personal service.
How to Measure Network Performance: 9 Network Metrics
In this article we’re running you through what is Network Performance, how to measure network performance, what network metrics we should collect to measure network performance, what is the impact of poor network quality on the most commonly used applications, and what tools you should use to monitor network performance.
Observability vs. Monitoring: What's the Difference?
Superfast Troubleshooting of Network User Performance Issues
HAProxy eBook Explains How to Leverage its Load Balancer as an API Gateway
Don't Let Network Issues Hurt the Employee Experience
We’ve all been there: the Zoom call that drops out in the middle of a crucial discussion; the browser application that won’t load when you badly need to access it. Network problems have been around since the dawn of the Internet, and they always will be. But during this recent period of remote working, connectivity issues have become a much bigger threat to workspace productivity and employee experience.
Understanding Network Speed And Latency
AWS Transit Gateways-Visualizing Cloud Routing with Kentik | Kentik Tech Talks, Episode 10
DX NetOps 21.2 Innovates with Scale, Speed, and Simplicity
DX NetOps 21.2 network monitoring software continues to innovate and improve the scale, speed, and simplicity of network operations with a focused set of high-value features and capabilities. Exciting new enhancements include increased monitoring scale, telemetry support, expanded SDN and cloud technology coverage, and usability and security updates. SCALE. Networks today handle a lot of data. That's why we are proud to support the largest deployments of networking technologies around the world.
DX NetOps 21.2 Continues to Improve Network Visibility with New Business Hours Filters
Fine-tune network uptime monitoring with OpManager
Uptime monitoring has a direct impact on your organization’s ability to support end-users and deliver services. Not maintaining adequate uptime can interfere with business productivity and impact end-user satisfaction, eventually resulting in financial losses. Establishing uptime can be a challenging task since there are numerous factors that can act against it.
Failover Internet - What Your Business Needs To Know
DX NetOps 21.2 Innovates with Scale, Speed and Simplicity
Global Site Load Balancing Explained
Global Site Load Balancing (GSLB) is an important part of your application infrastructure, but many people don’t understand its benefits. In this post we’ll explain how GSLB works and how LoadMaster GEO can bring big benefits in availability and performance at a fraction of the cost of alternatives.
Capgemini Requirements for NOC Transformation
Why ScienceLogic for Capgemini's NOC Transformation?
Unify Visibility Across Your Monitoring Tools with DX Operational Intelligence
For today’s businesses, there’s a premium on delivering innovative user experiences. As a result, stakes continue to grow for the teams in charge of supporting new digital experiences. To successfully implement modern delivery chains, IT operations need to establish comprehensive coverage that delivers unified visibility of the entire enterprise ecosystem. They need observability that spans from mobile applications to networks and mainframes.
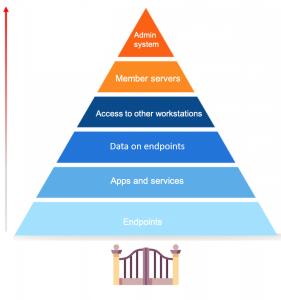
The role of endpoints in the security of your network
Endpoint security is a hot topic of discussion, especially now with so many businesses shifting to remote work. First, let’s define what endpoints are. Endpoints are end-user devices like desktops, laptops, and mobile devices. They serve as points of access to an enterprise network and create points of entry that function as gateways for malicious actors. Since end-user workstations make up a huge portion of endpoints, we’ll be focusing on their security.
Auvik Presents: Rollup & Retrospective Q2 2021
Turning Cross-Stack Correlation Into Better Collaboration | THWACK Livecast Series Session #3
DPA Virtualized Database Video
N-able Announces New Addition to Its Executive Leadership Team, Naming Jeff Nulsen as Chief Marketing Officer
Transforming Network Monitoring For The "Everything-As-A-Service" Era
Modern applications enable enterprises to scale faster with better efficiency and resilience. The main advantage of a multi-cloud/hybrid cloud infrastructure is in its highly distributed architecture that offers proximity – bringing end users closer to the service provider.
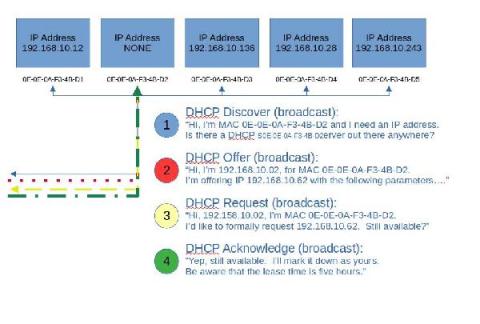
Basic DHCP concepts
Let’s step back and take a very basic look at DHCP. In fact, let’s look at the analogy of assigning a street address to your house. Usually, this is done by the local 911 dispatch office, or some other central authority. They typically use either a survey map or a latitude, longitude pair to locate you, before they assign your house numbers from a pool of available addresses, compatible with other addresses in the area.
How to Troubleshoot Network Issues | Obkio
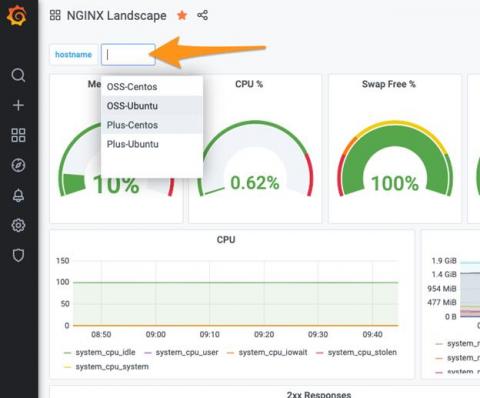
Using Grafana to measure the health of your NGINX instances with NGINX Instance Manager
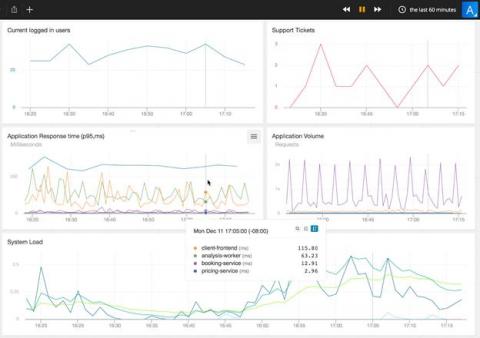
Grafana is an extremely powerful application and infrastructure observability and health platform. The ability to quickly generate operational insights from an amalgamation of sources is compelling. Grafana also benefits from the ability to natively query a Prometheus endpoint to display time-based metrics for display in a dashboard. We’ve built the NGINX Instance Manager tool to measure the health of your NGINX instances with the help of Grafana.
Ribbon IP and Optical Solutions for Research and Education Networks RENs
What The Future of Automated Network Operations Looks Like
Running a network operations center has never been simple, yet the scale and complexity that digital transformation has added makes the future of automated network operations look downright dizzying.
What is Network Visualization?
Top 5 causes of network packet loss and how to resolve them with OpManager
Network packets contain pieces of information that are sent and received enabling communication. When these network packets fail to reach their destination, it results in network packet loss. Network packet loss causes heavy latency and disruption, so, when a network suffers packet loss, it can lead to undesirable circumstances, and organizations might even end up losing business.
Customer Case Study: Telna
Run the HAProxy Kubernetes Ingress Controller Outside of Your Kubernetes Cluster
Run your HAProxy Kubernetes Ingress Controller in External mode to reduce network hops and latency. Traditionally, you would run the HAProxy Kubernetes Ingress Controller as a pod inside your Kubernetes cluster. As a pod, it has access to other pods because they share the same pod-level network. That allows it to route and load balance traffic to applications running inside pods, but the challenge is how to connect traffic from outside the cluster to the ingress controller in the first place.
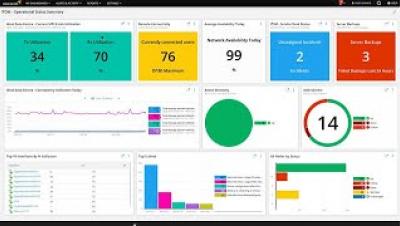
SolarWinds Orion Modern Dashboards Overview
7 key processes for running a top performing NOC
Much of the fuel for today’s business organizations is comprised of cloud computing and digital and SaaS applications. So, if something goes wrong with them, there will be a grave impact on productivity, customer satisfaction and even loyalty, as well as on the costs required for resolving the incident, remediating damage, and getting back to business.
Monitor your cloud architecture and app dependencies with Datadog NPM
Migrating your on-prem infrastructure to the cloud offers a host of benefits, including scalability, mobility, security, and cost reduction. When it comes to cloud network monitoring, tracking the availability and performance of the cloud services your applications rely on becomes even more important. However, moving from self-managed infrastructure to third party–managed services introduces a number of challenges.
The Rise of Unified Communications And Collaboration Tools In The Covid-19 Era
As we are now well than a year into the COVID-19 pandemic, businesses are continuing to adapt to ever-changing realities. Initially, adapting involved shuttering offices and canceling work-related travel and events. Today, however, COVID-induced changes are a bit more nuanced. In fact, large enterprises with advanced technology and work from home policies may notice little difference when comparing pre-pandemic operations to today’s.
2021 Building an SDWAN Requirements Document and Vendor Selection
N-able Amplifies Partner Success Initiatives with Launch of MarketBuilder and Addition of Three Head Nerds
Scale your business faster while ensuring reliability with Sumo Logic and NGINX
Use Microsoft Teams as Your Phone System: How to Get Started
3 Ways to Use Auvik APIs for External Reporting
N-able Expands Technology Alliance Program, Announces TAP Tank and Series of Customer Loyalty Incentives
Ribbon IP and Optical Solutions for Research and Education Networks (RENs)
Publishing & Securing Legacy Applications
In the previous blog post, we discussed load balancing essentials and methods of traffic distribution among the real servers. When you publish an application with Kemp LoadMaster you can add lots of extra capabilities on top of the basic load balancing. In this post we’re going to look at ways of securely publishing legacy applications using the LoadMaster Edge Security Pack (ESP) and SSL Acceleration features.
Consul Service Discovery for HAProxy
HAProxy with the HAProxy Data Plane API can integrate with Consul to enable service discovery for your load balancer configuration.
How to Measure Network Performance: 5 Network Metrics
As more companies continue to rely on SaaS and cloud applications to run their businesses, it becomes important for them to ensure their network infrastructures can withstand the demand, and that they’re able to offer their services quickly and reliably. Continuous network monitoring can help you ensure that your network is always performing at its highest level. So, we’re running you through exactly how to measure network performance, and what network metrics you should be looking at.
Resolve network security issues efficiently with the Firewall Analyzer-ServiceDesk Plus integration
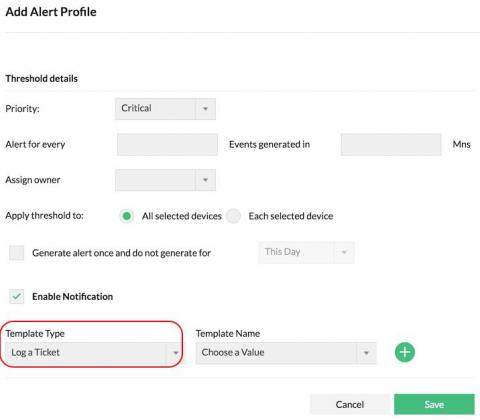
ManageEngine Firewall Analyzer reviews firewall logs to capture network security threats. It generates alerts upon detecting security threats and attacks, and notifies you, the security administrator, in real time. You can configure alerts to be sent via email, SMS, and more. With these real-time notifications, you can troubleshoot to take instant remedial action. You can also make changes to your firewall policies and configurations to prevent recurring security incidents.
SMTP Ports (25, 587, 465, or 2525) - What is SMTP Port? How to Choose the Best and Right SMTP Port?
It can be difficult to choose an SMTP port. When we set up the Simple Mail Transfer Protocol SMTP Server, the first question that comes to mind is this. Which port is the best for SMTP connections? There are a variety of ports to choose from, but which one should you use? Allow me to take you on a journey through the history of each port. It will give you a good understanding of all of the ports, and then we'll talk about which one is optimal for SMTP connections.
Investigating Network Anomalies - A sample workflow
Network anomalies vary in nature. While some of them are easy to understand at first sight, there are anomalies that require investigation before a resolution can be made. The MITRE ATT&CK framework introduced in Kemp Flowmon ADS 11.3 streamlines the analysis process and gives security analyst additional insight by leveraging knowledge of adversaries' techniques explaining network anomalies via the ATT&CK framework point of view.


