Operations | Monitoring | ITSM | DevOps | Cloud
January 2023
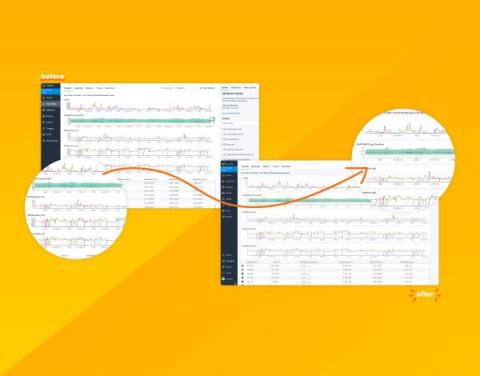
Your Data Just Got a Facelift: Introducing Honeycomb's Data Visualization Updates
Data visualizations take complex information and present it in a clean and easy-to-understand visual. Done right, they can allow quick insight through easy pattern and outlier recognition. Done wrong, it can confuse, obfuscate, and lead to wrong conclusions. Yikes! Over the past few months, we've been hard at work modernizing Honeycomb’s data visualizations to address consistency issues, confusing displays, access to settings, and to improve their overall look and feel.
Using AIOps for automation and efficiency in observability and IT operations
Artificial intelligence for IT Operations (or AIOps) has been playing an expanding role in helping SREs, DevOps, and developers effectively navigate the challenges around application and infrastructure complexity, pace of change, and data volume that characterize the operations landscape.
Webinar Recap: How Observability Impacts SRE, Development, and Security Teams
In today’s fast paced and constantly evolving digital landscape, observability has become a critical component of effective software development. Companies are relying more on and using machine and telemetry data to fix customer problems, refine software and applications, and enhance security. However, while more data has empowered teams with more insights, the value derived from that data isn’t keeping pace with this growth. So how can these teams derive more value from telemetry data?
Test Observability with Sumo Logic
The Right Time to Right-Size Your Observability Process
Every client we meet has been using multiple tools to satisfy their observability needs. We rarely find a greenfield opportunity. As their journey progresses, they have pointed out when the time is right to add ChaosSearch into the fold. There isn't just one symptom; it's usually a combination of things, including high log data volume, unpredictable costs, and ineffective results, to name a few. By the time we talk to clients in this state, the pain and frustration are incredibly high. We created a five-minute video to demonstrate how clients find themselves in this predicament.
How to Get Full Kubernetes Observability in Minutes
How is your organization handling Kubernetes observability? What tools are you using to monitor Kubernetes? Is it a time-consuming, manual process to collect, store and visualize your logging, metrics and tracing data? And, what are you actually getting out of all that investment? At Logz.io we’re trying to make this process easier for customers who are serious about Kubernetes observability. We’ve made significant investments in this area for Kubernetes use cases.
BindPlane OP Overview
Achieving Full Observability With Telemetry Data
In today's digital age, organizations increasingly depend on their technology infrastructure to keep their operations running smoothly. These infrastructures include servers, networking equipment, IoT devices, and applications. The data generated by all this infrastructure (logs, metrics, traces) is known as telemetry data, which has a tremendous potential value to organizations. However, it can be challenging to control telemetry data and utilize it effectively.
Maximizing Value and Minimizing Costs: Insights and Next Steps for Effective Tool Deployment
Monitoring with Prometheus vs Grafana: understanding the difference
How Developers Use Observability Pipelines
In data management, numerous roles rely on and regularly use telemetry data. The developer is one of these roles. Developers are the creative masterminds behind the software applications and systems we use and enjoy today. From conception to finished product, they map out, build, test, and maintain software.
Surface and Confirm Buggy Patterns in Your Logs Without Slow Search
Incidents happen. What matters is how they’re handled. Most organizations have a strategy in place that starts with log searches—and logs/log searching are great, but log searching is also incredibly time consuming. Today, the goal is to get safer software out the door faster, and that means issues need to be discovered and resolved in the most efficient way possible.
Observability Innovation Report 2023
StackState commissioned Techstrong Research, a strategy and technology analyst firm, to delve into the current state of observability. The resulting report, “Observability Innovation Report 2023,” provides insightful information. 543 IT professionals were surveyed, globally, across 20 industries. The largest concentration of respondents were in the telecommunications, technology, Internet and electronics sectors, followed by financial services.
Bad Observability
Observability has become a bit of a buzzword in the industry for the last few years. Exactly what "observability" means depends on who you ask, but most people would agree its about both: There's plenty of content out there telling you how to implement observability, or what good looks like. But what about bad observability? What are some anti-patterns to watch out for?
Reduce MTTR with Logz.io's Single-Pane-of-Glass Observability Data Analytics
Observability data provides the insights engineers need to make sense of increasingly complex cloud environments so they can improve the health, performance, and user experience of their systems. These insights can quickly answer business-critical questions like, “what is causing this latency in my front end?” Or, “why is my checkout service returning errors?” Observability is about accessing the right information at the right time to quickly answer these kinds of questions.
Implement a Cloud Security Observability Strategy in 6 Steps
Moving to the cloud is hard. Moving to the cloud and keeping systems secure, data governed, compliances met, and cyberattacks at bay, makes everyone’s jobs significantly harder. The number one concern we hear from Cribl customers about the cloud is, you guessed it — security. If you’re in this boat — eager to adopt the cloud ASAP but also worried about the risks that come with having sensitive data in the cloud — don’t fret. We’re here to help.
Easily analyze AWS VPC Flow Logs with Elastic Observability
Elastic Observability provides a full-stack observability solution, by supporting metrics, traces, and logs for applications and infrastructure. In a previous blog, I showed you how to monitor your AWS infrastructure running a three-tier application. Specifically we reviewed metrics ingest and analysis on Elastic Observability for EC2, VPC, ELB, and RDS.
On-premises to cloud: Observability for customers where they are and where they're going
Gain executive-level insights on Cisco AppDynamics’ for on-premises, hybrid and cloud customers from Ronak Desai, Cisco SVP & GM AppDynamics and full-stack observability.
Getting started with unified observability for Azure in less than 10 minutes using terraform
Honeycomb, Meet Terraform
Most SaaS products have nice, organic growth when they work well. Employees log in, they click around and make stuff, then they share links with others who do the same. After a few weeks or months, there are thousand of objects. Some are abandoned, and some are mission-critical. Different people also bring different perspectives, so they name things that are relevant to their role and position in the team, which may be confusing to others outside their realm.
What is Observability Engineering all about? One minute overview.
Jack Henry Incorporates BubbleUp and Honeycomb's New Service Map to Quickly Debug Issues and Get Ahead of Customer Latency
Not long ago, we announced the launch of Honeycomb’s Service Map, a new feature that gives users the ability to get an overall, filterable view of their system and how everything is connected, along with some exciting new enhancements to BubbleUp. What’s the story behind these changes? They make it even easier for developers to zero-in on issues, even when they are hidden in billions of lines of code.
Applying Lessons Learned from Baking Pizza to Kubernetes Observability
Baking a delicious pizza in a wood-fired oven requires a combination of skill, experience and the right tools. The same is true for achieving optimal observability in a Kubernetes environment. In this post, we'll explore some of the lessons learned from baking pizza in a wood-fired oven and apply them to the world of Kubernetes observability.
Observability vs Monitoring vs Telemetry: Understanding the Key Differences
Observability, monitoring, and telemetry are crucial for maintaining the performance and reliability of modern systems. Their concepts are often used interchangeably, but they have distinct differences that are important to understand. In this blog, we’ll explore each concept in detail, including key characteristics and examples of tools. We’ll also compare observability vs monitoring vs telemetry and discuss when it’s appropriate to use each.
Single Vendor vs Best of Breed Solutions: A Livestream Debate on 2023 Trends
Counting Forest Fires
If you were asked to evaluate how good crews were at fighting forest fires, what metric would you use? Would you consider it a regression on your firefighters’ part if you had more fires this year than the last? Would the size and impact of a forest fire be a measure of their success? Would you look for the cause—such as a person lighting it, an environmental factor, etc—and act on it? Chances are that yes, that’s what you’d do.
Cloud Observability For IT
Observability has become increasingly important for IT professionals as the complexity of modern systems has grown. In the past, IT environments were typically composed of a few servers and applications that were all running on-site. However, with the rise of cloud computing, IT has become more distributed, with applications and services running on a wide variety of infrastructure and platforms.
What Is Observability?
Splunk Data Insider: What is Observability?
Routing Strategies for Security and Observability Data: How to Make the Most of Your Data at Scale
Data routing is a crucial but complex task for companies of all sizes. Ensuring that the right data is sent to the right tools can be a time-consuming and difficult process, and when things go wrong, it can have costly consequences. This is why having a robust data routing strategy is essential for any organization.
10 Points of consideration for investing in an Observability Platform for your organization.
Authors' Cut Spark Notes Edition: Jumpstart Your Observability Journey
Whether you’ve been following along with our Authors’ Cut series or doing some self-paced learning, our O’Reilly book Observability Engineering is one of the best resources for jumpstarting your observability journey. It serves as a blueprint to help you understand and map out the technical and cultural requirements of implementing observability into your organization.
Techstrong TV Interview: Toffer Winslow Talks Observability
30+ Top Observability Tools to Monitor Websites and Applications
By incorporating observability into your stack, you can better understand how your complex infrastructure operates, reduce downtime, and empower developers to quickly identify and fix problems. However, it now takes considerably more work, time, and money to build up observability for your infrastructure and applications. Over half of the firms polled employ eight or more observability solutions, according to a 2022 Splunk survey.
3 Easy Ways to Get Started With Distributed Tracing
Not to put too fine a point on it, but we think distributed tracing gets a very bad rap for being too complicated and labor-intensive. We’re here to show you three ways you can jumpstart a distributed tracing effort, starting small and expanding as it makes sense. These examples involve only a little code and perhaps a bit of a mindset change. Starting small with distributed tracing can even be fun, because who doesn’t like getting customized results without much work?
New Year's (observability) Resolutions
A new year has started and I've been pondering my hopes and dreams for the year to come. In the world of SRE, observability is the most prominent pillar of my work. So, I decided to drill into the topic of observability and what I'd like to see happen in the industry in 2023. Rather than focusing on any tool, technology, or methodology, I'lll be exploring concepts that can be broadly applied in any organization.
Introducing CloudZero Support For New Relic: Enabling A More Efficient Approach To Observability
Elastic Observability 8.6: Maximizing operational efficiencies with improved application analysis and workflow integrations
Elastic Observability 8.6 introduces a set of capabilities improving production operations through the introduction of host (EC2/GCP compute/Azure compute) observability, application dependency operations views (insights into databases, caches, etc), and a new connector for Opsgenie. These new features allow customers to: Elastic Observability 8.6 is available now on Elastic Cloud — the only hosted Elasticsearch offering to include all of the new features in this latest release.
The Importance of Observability
What Databases Taught Me About Scaling Observability
The Five Myths of Observability
Observability is a term that has gained a lot of traction in recent years, particularly in the realm of software engineering and DevOps. At its core, observability refers to the ability to gain insight into the internal workings of a system by observing its external outputs. This allows engineers to diagnose and troubleshoot issues with the system, as well as to monitor its performance and behaviour.
How can observability cultivate collaboration among engineering teams?
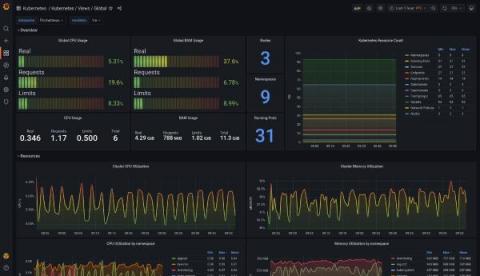
How to monitor Kubernetes with Grafana and Prometheus: Inside Powder's observability stack
David Calvert is a site reliability engineer working remotely from the south of France. He’s currently focused on observability, reliability, and security aspects of cloud infrastructure. You can find him as dotdc on GitHub and @0xDC_ on Twitter. Over the past three years, I’ve built and operated Kubernetes clusters for two different companies — the first one on-premises, and the second on a public cloud platform for my current job at Powder.
How to Deploy a Cribl Stream Leader, Cribl Stream Worker, and Redis Containers via Docker
Author's Cut-A Sample of Sampling, and a Whole Lot of Observability at Scale
Brick by brick, block by block—if you’ve been with us throughout our Author’s Cut blog series (and if you haven’t, you can go catch up), you’ve seen us build the case for observability from the ground up. We’ve covered structured events, the core analysis loop, and use cases for managing applications in production—and that’s just to start.
Security Observability Trends for 2023
Bifurcating Observability Data To Multiple Destinations
Are you just getting started with Cribl Stream? Or maybe you’re well on your way to becoming a certified admin through our Cribl Certified Observability Engineer certification offered by Cribl University. Regardless, using Cribl Stream to send data from one source to many destinations is something you’ll want to try. So if you’re ready, read on!
The Year of the Observability Pipeline
As we begin the new year, it is customary to reflect and identify areas we can continue to grow in 2023. Whether it’s joining the local gym, starting a new diet, or taking up a new hobby, this time is always full of promise to continually improve. The same can be said for digital businesses of every size and across every vertical. Macroeconomic trends have especially made this time one of reflection for a number of organizations.
The Reality of Machine Learning in Network Observability
For the last few years, the entire networking industry has focused on analytics and mining more and more information out of the network. This makes sense because of all the changes in networking over the last decade. Changes like network overlays, public cloud, applications delivered as a service, and containers mean we need to pay attention to much more diverse information out there.


