Operations | Monitoring | ITSM | DevOps | Cloud
December 2023
OpenTelemetry ECS Tutorial - Monitor AWS ECS metrics [Step-By-Step Guide]
Webinar Recap: Saving the Holidays with Quix and InfluxDB: The Open Telemetry Anomaly Detection Story
Just in time for your holiday viewing! Learn how to solve real-time time series processing challenges with Quix—the stream processing framework using Kafka and Python—and purpose-built time series database InfluxDB.
What is Open Telemetry?
Top 11 Kubernetes Monitoring Tools[Includes Free & Open-Source] in 2024
2024 Unveiled: Catchpoint's Predictions for APM, ITOM, OTel & Beyond
As the holiday season rolls in, it’s not just about festive cheer and resolutions; it’s also time for industry leaders to cast their predictions for the new year. This year, Catchpoint’s thought leaders have stepped up with their hottest takes for 2024. Catchpoint experts are envisioning a transformative shift in the monitoring technologies, a heightened focus on performance as a key metric, and an integrated strategy for managing digital performance management.
The Power of Distributed Tracing in Shifting Observability Left
This is the second post in a 3-part series about shifting Observability left. If you have not had a chance to read the first, you can find it here. In today’s complex microservices deployments, gaining visibility into deployments is vital for optimal system performance and scalability. This has become even more important as the tech industry has moved toward microservice architecture reliance. Navigating through logs has become increasingly complex as requirements have grown.
Three Pillars of Observability [And Beyond]
Cool Retrace Feature - Email and share your Dashboards
OpenTelemetry best practices: A user's guide to getting started with OpenTelemetry
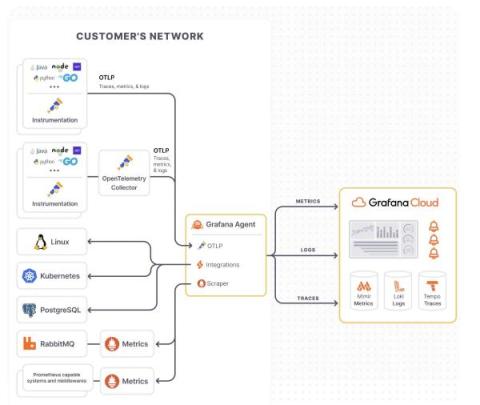
If you’ve landed on this blog, you’re likely either considering starting your OpenTelemetry journey or you are well on your way. As OpenTelemetry adoption has grown, not only within the observability community but also internally at Grafana Labs and among our users, we frequently get requests around how to best implement an OpenTelemetry strategy.
A Bright New Era in Developer Troubleshooting with Lumigo and OpenTelemetry
At Lumigo, building developer-first tools has always been at the forefront of our approach to troubleshooting and debugging. As developers ourselves, we have experienced firsthand the frustration and intricacies of sifting through logs looking for answers. We’ve also felt the pressure of the clock ticking, with production issues waiting to be resolved and the need for timely answers to surfaced application issues.
OpenTelemetry Overview
Monitoring distributed systems means collecting data from various sources, including servers, containers, and applications. In large organizations, this data distribution makes it harder to get a single view of the performance of their entire system. OpenTelemetry helps you streamline your full-stack observability efforts by giving you a single, universal format for collecting and sending telemetry data. Thus, OpenTelemetry makes improving performance and troubleshooting issues easier for teams.
Lumigo Releases 1-Click OpenTelemetry for Microservices Troubleshooting
Lumigo is excited to announce its microservice troubleshooting platform now provides developers and DevOps with the power of OpenTelemetry (OTel) with a single click. Lumigo has long been the leading troubleshooting platform for serverless, but now, users can harness its best-in-class debugging and observability platform for all microservices-based environments.
Using OpenTelemetry Collector Loki Receiver to Send Logs to SigNoz [Code Tutorial]
Monitor HAProxy Metrics and Logs with OpenTelemetry [Step By Step Guide]
Combining AWS and Prometheus with OpenTelemetry
In the realm of data and complex scenarios, we humans naturally gravitate towards visualizing things as entities with attributes, rather than just raw data. Consider the phrase, “The response time on our Ad Generation service has increased.” It immediately resonates with the audience supporting the service.
OpenTelemetry vs Jaeger : Comparing Apple and Oranges
Traces to metrics: Ad hoc RED metrics in Grafana Tempo
OpenTelemetry Auto & Manual Instrumentation Explained with a Sample Python App
Health Check Monitoring With OpenTelemetry | Complete Code Tutorial
How to Instrument Java Applications using OpenTelemetry - Tutorial & Best Practices
Amazon EKS Monitoring with OpenTelemetry [Step By Step Guide]
ELI5 Distributed tracing #observability #tracing #tempo
How to get started with Tempo with Joe Elliott (Grafana Office Hours #22)
A Practical Guide to Debugging Browser Performance With OpenTelemetry
So you’ve taken a look at the core web vitals for your site and… it’s not looking good. You’re overwhelmed, and you don’t know what change to make because everything seems like too big of a project to make a real difference. There are so many measurements to keep track of and the standards cited seem even scarier. This is extremely normal. Web performance standards can feel impossible to meet for a lot of us.


