Operations | Monitoring | ITSM | DevOps | Cloud

Exploring OpenTelemetry Collector configurations in Grafana Cloud: a tasting menu approach

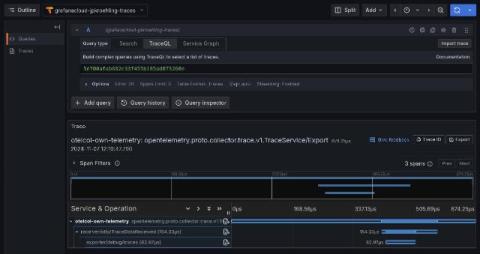
I’m a big fan of tasting menus. In the culinary world they let us sample a variety of dishes in small portions, helping us understand and appreciate different flavors and options. Inspired by this concept and a talk I gave earlier this year, I have crafted a “tasting menu” of OpenTelemetry Collector configurations in Grafana Cloud.
Why companies choose Grafana Cloud over self-hosted OSS stacks

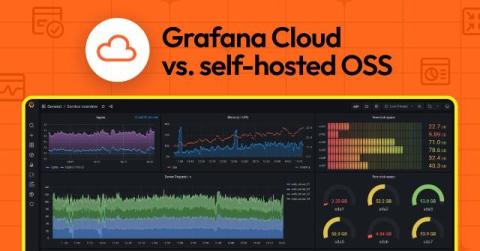
While we all love open source technology and the community that comes with it, we don’t always have the time or resources to stand up, maintain, update, and troubleshoot a self-hosted OSS stack. This is one of the (many) reasons companies choose to implement Grafana Cloud: you get all the goodness of the open source Grafana LGTM Stack (Loki for logs, Grafana for visualization, Tempo for traces, Mimir for metrics) in a fully managed, end-to-end observability platform.

Building Interactive Dashboards: Why React-Grid-Layout Was Our Best Choice

After releasing our first version of the ilert dashboard as a static layout, we knew we wanted to take it further by allowing users to customize and arrange widgets freely. We aimed to provide a truly interactive experience, which led us to search for a library that could handle drag-and-drop and resizing functionalities while integrating well with our existing tech stack.

How to use OpenTelemetry and Grafana Alloy to convert delta to cumulative at scale

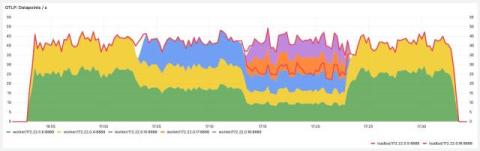
Migrating from other vendors becomes a lot easier with OpenTelemetry and Grafana Alloy, our distribution of the OpenTelemetry Collector. But when you come from platforms that use different temporalities, such as Datadog or Dynatrace, you face a challenge integrating with a Prometheus-like ecosystem such as Grafana Cloud: Your metrics still mean the same as before, but they just don’t look right.

Leveraging OpenTelemetry and Grafana for observing, visualizing, and monitoring Kubernetes applications

Ken has over 15 years of industry experience as a noted information and cybersecurity practitioner, software developer, author, and presenter, focusing on endpoint security, big security data analytics, and Federal Information Security Management Act (FISMA) and NIST 800-53 compliance. Focusing on strict federal standards, Ken has consulted with numerous federal organizations, including Defense Information Systems Agency (DISA), Department of Veterans Affairs, and the Census Bureau.

5 tips to write better browser tests for performance testing and synthetic monitoring

Given the complexity of modern websites, browser testing is essential to ensure a positive user experience. With the Grafana k6 browser module, you can interact with real web browsers and simulate user interactions — like clicking, typing, or navigating pages — to collect frontend metrics, increase site reliability, and fix performance issues before they ever impact your users.

How Evidi built the perfect MSP single pane of glass

.NET + DevOps Developer, Evidi Evidi – an IT consultancy and managed service provider based in Norway – are on a mission to help businesses harness the power of the Microsoft stack and realise their ambitions. With a large portfolio of services and a growing network of customers to manage, Evidi faced a challenge relatable to any MSP: They needed better visibility, and the solution had to be cost-effective and scalable.

Getting Started with Google Sheets Data Source Plugin - Visualize your Spreadsheets | Grafana

Learn step-by-step how to monitor and visualize your Google Spreadsheets data by using the Google Sheets Data source plugin and view it in a Grafana Dashboard. Join Senior Developer Advocate Syed Usman Ahmad in this complete video tutorial and learn to use the Google Sheets plugin.