Operations | Monitoring | ITSM | DevOps | Cloud

The latest News and Information on Distributed Tracing and related technologies.

Trace linkage: connect the dots between your app traces and database queries

When an application request slows down, a trace can show a database call. Finding the database query behind it can be tedious, requiring you to switch between traces and database telemetry, as well as match timestamps or query text by hand. In Grafana Cloud, the Database Observability app already provides a window into all of your database telemetry, including query samples, performance history, and explain plan.
Bridging Alloy and OpenTelemetry: the OTel engine is now in Public Preview

Many Grafana Cloud customers love what Alloy offers them, but we're also seeing a growing base of users who feel the same way about the OpenTelemetry Collector. We want to make it easy for customers to make the decision that makes the most sense, regardless of their preference.

Finding performance wins in our own traces with a coding agent

For the last few weeks I’ve used a coding agent to find and fix backend performance issues in Sentry, starting from the traces Sentry sends to itself. Most of the fixes only changed a line or two. But together, they removed hundreds of millions of queries a week, and some expensive lookups became hundreds or thousands of times faster (more details on that below).

Connecting Cloudflare and Honeybadger with OpenTelemetry

Honeybadger Insights is pretty great. It's even greater when you connect it to Cloudflare and start shipping logs directly from Cloudflare Workers to Insights. If you're already using Cloudflare to distribute your applications, it's easy to set up. Cloudflare Workers logs capture what your application is doing at the edge: console.log() output, uncaught exceptions, and system-generated logs for each request.

Five things you can do with Sentry's Agent Tracing

AI-powered apps are hard to debug without observability. From one run to another, AI produces different results, goes down different paths, and you’re none the wiser as to why it’s happening. Agent Tracing bridges the gap between prompt, tool calls and final output, all within the context of your app. If things break (it always does at some point, we know from experience), you get everything in one complete trace.

Managing Collectors at Scale: OpAMP and Fleet Management (Grafana OTel Community Call #11)

In this episode of the Grafana OTel Community Call, we're joined by Bejal Lewis and Paschalis Tsilias from Grafana Labs to talk about OpAMP, the Open Agent Management Protocol, and what it takes to manage OpenTelemetry Collectors at scale. We'll cover what OpAMP is and why fleet management matters, where the spec stands today (it's still pre-release), and what it was like building production tooling on top of it.

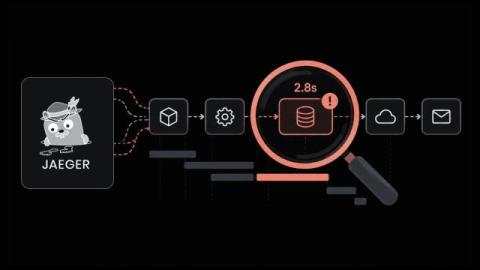
What is Jaeger Tracing and How does It Locate Slowdowns Across Microservices

Why does a checkout or login take several seconds when CPU and memory look normal on every server? In microservices, one click can travel through a long chain of components before the user sees a response. Any one of them can hold the request up, and server graphs won't tell you which. Logs show what each service recorded. Metrics give you averages. What's missing is the path one request took and the place it lost time, and Jaeger tracing records exactly that.

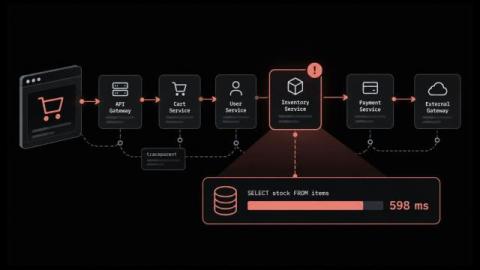
What is Distributed Tracing? How a Request Becomes a Trace

A checkout request leaves the browser and touches seven services before anything comes back. Seven dashboards light up. Every one of them reports a healthy number for its own service, and every one of them is telling the truth about a different slice of the work. Nobody measured the request. That gap is what pushed tracing in beside metrics and logs as a core signal of observability. In this blog, you will: By the end you will open a trace and say where the time went.

MCP Server Monitoring: Tracing Tool Calls with OpenTelemetry

MCP server monitoring guide: spans, metrics and logs to record for tool calls, why failed tools look healthy, and how to trace requests from client to server. Sejal Pandey works on content and growth at Last9, writing about observability, reliability, and SRE practices.

What is Zipkin and How does Distributed Tracing Speed Up Incident Resolution

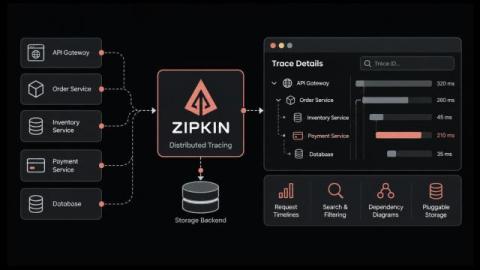
If a checkout slows down or an API call fails, why can the cause stay hidden for so long while every service dashboard looks fine? One customer click in a microservices setup may hit a gateway and a few backend services first, then a queue or a database. Every hop logs its own events, yet none of those logs points back to the original request. Distributed tracing was created to solve exactly this. Zipkin arrived early, as one of the first open-source tracers.