Operations | Monitoring | ITSM | DevOps | Cloud

February 2024

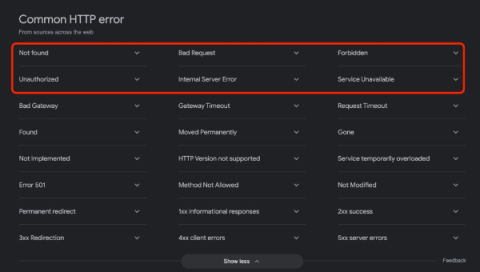
The Five Most Common HTTP Errors According to Google

Sometimes when you try to visit a web page, you’re met with an HTTP error message. It’s a message from the web server that something went wrong. In some cases, it could be a mistake you made, but often, it’s the site’s fault. Each type of error has an HTTP error code dedicated to it. If you try to access a non-existing page on a website it leads to a 404 error. Now, you might wonder, which are the most common HTTP errors that people encounter when they surf the Web?

Top 5 Outcomes CIOs Need to Accomplish by 2025: Driving Business Value Through Technology

In January 2024, I published findings from some of my recent research as, “Top 5 Outcomes CIOs Need to Achieve by 2025: Driving Business Value Through Technology.” By focusing on these five key outcomes, CIOs can ensure that their technology investments directly contribute to business growth, resilience, and competitive advantage in the years leading up to 2025.

Beyond Logs: Navigating Entity Behavior in Splunk Platform

Identifying bad actors within your organization often feels like a complicated game of hide and seek. A common comparison is that it's akin to finding a needle in a haystack. So, if the bad actor represents the 'needle' and your organization the 'haystack,' how would you uncover these bad actors? Perhaps the quickest way to find the needle is by burning the haystack. Alternatively, dumping the hay into a pool of water and waiting for the needle to sink to the bottom could also work.

Easy guide to Monitoring Puppet with Telegraf and MetricFire

Monitoring your Puppet runs and automations is essential for maintaining performance, reliability, security, and compliance of your infrastructure. It allows you to stay ahead of potential issues, optimize resource utilization, and ensure a smooth and efficient operation of your database system.

How Complyt used Datadog's Cloud Cost Management to reduce their cloud spend

Learn how the team at Complyt was able to integrate Cloud Cost Managament in a matter of hours and quickly pinpoint underutilized services to cut their cloud spend in half. CCM delivers cost data where engineers work and with resource-level context like CPU, memory, and requests — easily scoped to their services and applications — so that they can take action and spend effectively.

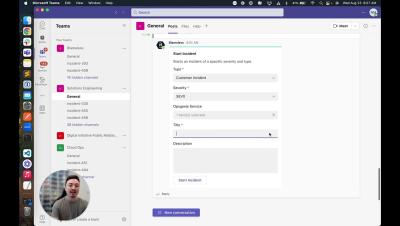
See all PRs, Issues & WIPs in the CLI #GitKraken #FocusView #shorts

Command line environments can feel stale. You punch in something to get something out, and sometimes, that's all you need – but as projects grow, extra visual elements for organization become invaluable. 🚀 Focus View in the GitKraken CLI makes things easier. Navigate through lists, pop out links, switch tabs, and fine-tune what you see with Pin & Snooze. No more digging through one item at a time – everything you need is right there, at a glance. 🤩

Master Class: Monitoring from Your Users Perspective

Over the past decade, not only has the Internet and the World Wide Web evolved, but also the way websites & applications are developed and experienced by end users. From monolithic to microservice-based structures and from data centers to cloud computing, we’ve come a long way. We’re living in the era of the end-user experience. It’s never been easier for a customer to find another solution if your business isn’t meeting their expectations.

Much Ado About OpenTelemetry

There is so much good work that OpenTelemetry has done in the software industry, specifically around the domain of observability, in the last five years. Bringing users and vendors together to define the future of telemetry? Check! Unify logs, traces, and metrics under a completely vendor-neutral API? Check! Deprecate other standards by bringing their collaborators to the table to ensure their use cases are met? CHECK!

From Rage to Sage: Practical Steps to Achieving Windows Patching Zen

Force-close your Windows update-induced frustrations and boot up a fresh new era of patch management enlightenment. In this webinar, you’ll learn how to master: Bring your most confounding questions and frustrations and join us for a wisdom-packed session that's sure to help you bring peace to your environment.

Kubernetes Monitoring: How to Get Started in Grafana Cloud | Grafana

Start monitoring your Kubernetes cluster in less than 3 minutes! This is a quick but comprehensive guide for getting started with Kubernetes Monitoring in Grafana Cloud. Ideal for both beginner and experienced users, you'll see a step-by-step approach for installing the Helm chart on your Kubernetes cluster so you can validate the health and integrity of your infrastructure. Helpful links: ☁️ Grafana Cloud is the easiest way to get started with metrics, logs, traces, dashboards, and more. We have a generous forever-free tier and plans for every use case.