Operations | Monitoring | ITSM | DevOps | Cloud

August 2023

Grafana JSON API: How to import third-party data sources in Grafana Cloud

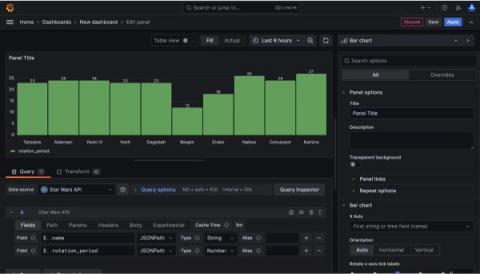
Have you ever wanted to test out Grafana Cloud but don’t have any available data to monitor? Well, have no fear! With the Grafana JSON API plugin, you can query publicly available JSON endpoints. The JSON API is a wonderful way to start using Grafana Cloud. You can quickly see data in action, and there are a multitude of things you can build, analyze, and monitor using the JSON API.

Introducing Error Groups to the Raygun API

We’re excited to announce an important extension to our API. After rigorous research, testing, and feedback, we’ve launched the Error Groups endpoints. This powerful new addition aims to enhance your monitoring experience and better handle errors across your applications. Our primary aim with the introduction of these endpoints is to offer you a more detailed view into your applications’ error groups, and to offer a way to update their statuses using the API.

Understanding the API economy

APIs (Application Programming Interfaces) have been around for decades, but although the concept emerged as far back as the 1940s, it wasn’t until the early 2000s and the efforts of eBay, Salesforce, and Amazon that really put them on the map. APIs today are ubiquitous - any company developing software will likely have an API for customers and partners - and research suggests the majority of enterprises consuming APIs are focused on strategies for easier consumption and management of APIs.

New API authentication Pandora FMS

Pandora FMS external API is used to integrate third party applications with Pandora FMS and now we will be able to authenticate against it using the Bearen Token. It is a type of identification through HTTP headers that allows that each registered user in our Pandora FMS server can generate its own identifier of unique correspondence to make calls to the same API. In today's video we are going to show you how to generate these identifiers of the users of our server and how to make calls to the API with this identifier.

eCommerce Load Testing (Step 3): Build the Environment

In this webinar clip from "Ensuring performance: How major retailers leverage user traffic to validate code changes", Speedscale Co-founder, Nate Lee, explains what to consider when building the environment, including backend dependencies and data. He covers how service mocking can help companies test at a higher velocity in today's complex development environments.

Replicating Traffic: Use Cases & Benefits

In this webinar clip from "Ensuring performance: How major retailers leverage user traffic to validate code changes", Speedscale Co-founder, Nate Lee, talks about why traffic-based testing (unlike manually writing script tests) can help companies move faster and test at the speed of development. He covers the top use cases and benefits of leveraging traffic as the new way to test.

How Modern Retailers Approach Software Testing (4 Steps)

In this webinar clip from "Ensuring performance: How major retailers leverage user traffic to validate code changes", Speedscale Co-founder, Nate Lee, shares how modern retailers are thinking about and approaching software testing in increasingly dynamic and complex environments.

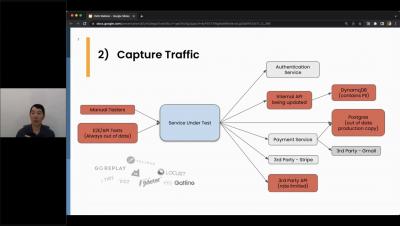
eCommerce Load Testing (Step 2): Capture Traffic

In this webinar clip from "Ensuring performance: How major retailers leverage user traffic to validate code changes", Speedscale Co-founder, Nate Lee, explains what comes next after selecting the business-critical APIs to test first: capturing traffic. Capturing traffic for the service can be done through tools like Speedscale, GoReplay, VCR, K6, and JMeter.

What is an API Gateway?

API Gateways are vital components in today's digital landscape, facilitating seamless communication between systems and applications. To ensure optimal performance, monitoring API Gateways is crucial. MetricFire offers a comprehensive monitoring platform that tracks and analyzes key metrics, providing real-time insights into performance indicators such as latency, error rates, and throughput.

The Darkside of GraphQL

GraphQL is a query language for APIs that provides a powerful and efficient way to query and manipulate data. As powerful and versatile as GraphQL is, its downside is that it can be vulnerable to certain security threats. In this presentation, we will discuss the security vulnerabilities associated with GraphQL, from the basics to more advanced threats, and how to best protect against them. After this presentation, attendees will have a better understanding of security vulnerabilities in GraphQL, as well as an understanding of the steps needed to protect against them.

Ensuring performance: How major retailers leverage user traffic to validate code changes

As featured on CMG.org: Software development and testing is ultimately all in preparation for go-live. But what if you could predict how your go-live could go wrong? In this webinar, learn how traffic-based tests and mocks can accurately simulate peak load conditions, ensure performance, and increase your top line revenue.

Checkly Advances Monitoring as Code with New User-Centric Features

Checkly, the leading provider of monitoring solutions powered by a Monitoring as Code (MaC) workflow, has unveiled two groundbreaking features: the Activity Log and Code Exporter. These innovative features not only enhance transparency and simplify the adoption of MaC practices but also mark a significant step forward in Checkly's commitment to advancing the MaC movement, offering users an end-to-end workflow that integrates seamlessly with modern software development practices.

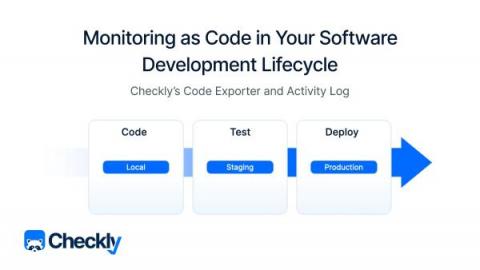
Monitoring as Code in Your Software Development Lifecycle

When we launched the Checkly CLI and Test Sessions last May, I wrote about the three pillars of monitoring as code. Code — write your monitoring checks as code and store them in version control. Test — test your checks against our global infrastructure and record test sessions. Deploy — deploy your checks from your local machine or CI to run them as monitors.

Integrate Monitoring as Code into your Software Development Lifecycle

Learn how the new Checkly features (code exporter and activity log) enable you to integrate Monitoring as Code into your Software Development Lifecycle. Define and debug your monitoring resources during development, test your preview deployments and start monitoring productions with ease.

Synthetic Monitoring: What is it, Challenges, and How to Get Started

With Infrastructure as Code and service-oriented development, a modern web app can consist of countless moving parts developed by multiple development and DevOps teams. When establishing a high-velocity development environment, the main question is, "How can you guarantee a stellar end-user experience when lots of engineers are constantly pushing and deploying code?" Solid, easy-to-write, and clearly defined monitoring practices are the only answer to this question.

How to monitor connector's API Connections in Logic Apps?

Let us consider a scenario where a Logic App is used to communicate with SharePoint through API connections, known as connectors. When configuring the connector, it communicates with Azure AD, retrieving a username and password and continuously refreshing the authentication token. When the Logic App calls the connector, it performs operations like uploading files to SharePoint.

Monitor gRPC calls with OpenTelemetry - explained with a Golang example

gRPC (Google Remote Procedure Call) is a high-performance, open-source universal RPC framework that Google developed to achieve high-speed communication between microservices. gRPC has Protobuf (protocol buffers) by default which would format or serialize the messages to a specific format that will be highly packed, highly efficient data. By its virtue of being a lightweight RPC, gRPC is suited for many use-cases. gRPC can be considered a successor to RPC, which is light in weight.