Operations | Monitoring | ITSM | DevOps | Cloud
August 2021
Installing SigNoz on your Ubuntu VM via Install script
SigNoz Community Call - August 2021
This Month in Datadog: August 2021 (Episode 4)
Improving Web Page Load Time
HTTP/2 (originally named HTTP/2.0) was a major revision of the HTTP network protocol used by the World Wide Web published in 2015. Indeed, those in the Citrix/EUC ecosystem may remember Marius Sandbu investigating the benefits of HTTP/2 for NetScaler, Microsoft IIS, and Storefront users back in 2015/6. HTTP/2 was the first new version of HTTP since HTTP/1.1, which itself was standardized in RFC 2068 in 1997.
Datadog vs. New Relic vs. Scout
Application performance management is one of the essential steps that every business must complete to ensure that their products work as desired and give the best experience to the end-users. There are many tools for application management available in the market, but if you want to select the best one for your business, you would need to try out each tool one by one.
What Will APM Look Like in the AIOps Era?
Auto-instrument your .NET applications with OTEL Collector
How to Determine Whether an Error is Really an Error
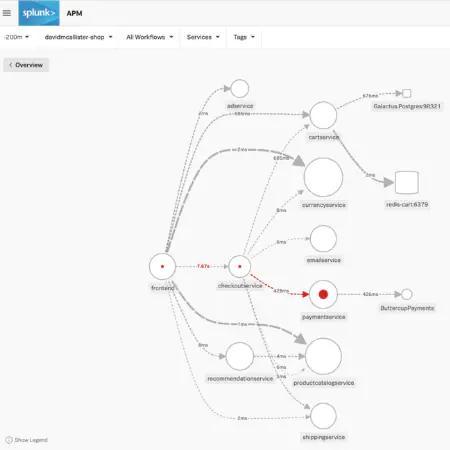
There is nothing worse than waking up to an angry customer complaining that your website is failing to accept their payment at checkout. This may be worrying for some since payments not being processed can be equivalent to losing money; however with Tag Spotlight, this should be a relatively quick problem to dissect. The key question here is whether this is an issue that all our customers are facing or an isolated event.
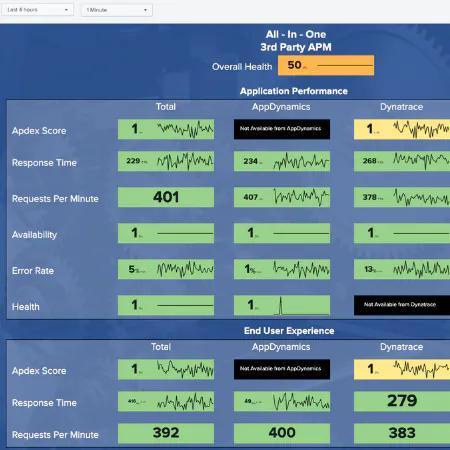
The Best Things Come in Content Packs: Synthetic Managing and Third-Party APM
We recently announced the new Splunk App for Content Packs, your single source for all the goodness that is content packs. This new app makes it easier than ever to get started with Splunk for IT use cases. Individual content packs come with prepackaged content and out-of-the-box searches and dashboards, helping streamline workflows and ensuring you get the most out of your usage with Splunk IT Service Intelligence (ITSI) and Splunk IT Essentials Work (ITE Work).
Appdynamics vs. Splunk vs. Scout | Key Features Compared
Application Performance Monitoring is a crucial necessity for modern businesses. No application can survive without a proper monitoring system. There are way too many things that can go wrong, so you must put your best foot forward in terms of choosing a monitoring system that is effective and economical at the same time. This guide aims to help you decide between three top application performance monitoring tools in the market - AppDynamics, Splunk, and Scout.
Deployment Choices for eG Enterprise
You have two choices when deploying eG Enterprise: Wherever you choose to locate your eG Manager, eG Enterprise does not and will never collect data from your systems. There is never a data feed going from eG Manager to any outside system unless specifically configured by the customer and we do not incorporate any dubious call-home technologies. Before installing eG Enterprise, you will also need to consider the factors discussed in the Where to locate the eG Manager?
The Wicked Problems Cookbook
Centralized Log Management and APM/Observability for Application Troubleshooting and DevOps Efficiency
Dynatrace vs. SolarWinds vs. Scout
Software development has always played a vital role in the development of a business. But software development is not only the coding of a part of the software; it also extends to debugging, testing, releasing frequently, and monitoring. Application performance monitoring is one of the most essential things that every software needs to do because a running software application can always go wrong in ways unimaginable.
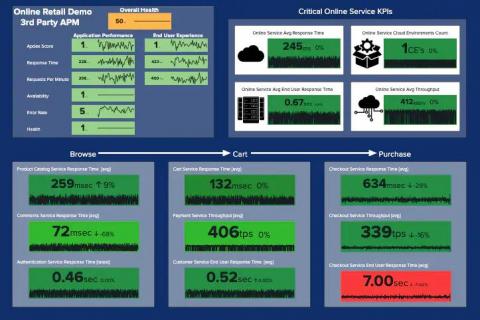
3rd Party APM: Unite Your Legacy APM Data on Your Journey to Observability!
Today you likely have one or more legacy APM (Application Performance Monitoring) solutions. You are moving from a monolithic architecture to microservices, and you are accelerating your journey to Cloud, and you need to deliver at speed with scale and quality to your customers. Sadly, visibility into these results are limited to each of these solutions and their interfaces.
Monitoring the Citrix Delivery Controllers
When the Citrix architecture moved from v6 to v7, one of the main components that was introduced in the v7 architecture was the Citrix Delivery Controller (CDC). A Citrix Delivery Controller is a server-side component that is responsible for managing user access and brokering (enabling application and desktop access) and optimizing connections. Each site will have one or more delivery controllers.
Upgrade your monitoring experience with our reimagined mobile app
Attention, on-call warriors! You asked, we answered — we’re excited to announce that our reimagined mobile app is now generally available to our customers.
Podcast - How eG Innovations and Citrix complement each other
The Citrix Ready team recently recorded a podcast with eG Innovations for their Tech Fusion podcast series. Hosted by Neil C. Hughes from The Tech Blog Writer, Rachel Berry from eG Innovations’ product team, and CTP, Richard Faulkner, (Enterprise Solutions Architect, Conversant Group) discussed how eG Enterprise enhances and goes beyond native Citrix tools.
Preparing for the Elastic Certified Observability Engineer Exam - Get Elasticsearch Certified
Monitoring SAP Services End-to-End
A typical SAP deployment is usually a sprawling, complex system and is one of the most critical applications an enterprise relies on to keep the business functioning, with it interacting with production, sales, dispatch, HR, and other areas of the business. Monitoring the performance and availability of SAP is therefore the key. Proactive monitoring may allow minor issues to be resolved before they become major issues.
A major release, tons of bug fixes and amazing new contributors - Signal #03
8 Dynatrace Alternatives to Consider in 2021
Everywhere you look, you see something to do with software and applications. But for all this software to work well, the people behind them have to know how they work. For a software developer, this comes as no surprise. They need to know how their code is working when deployed. Before the software deploys, they want to iron out errors, so they don’t become problematic and frustrate customers.
Extend Your APM Capabilities With End-User Data
Announcing: Greater visibility into Core Web Vitals
Monitor your Tomcat Java Application in 20 mins with OpenTelemetry & SigNoz
What is Application Performance Management (APM)? Overview and 11 Features to Look for in APM Tool
Application Performance Management is all about gaining a complete picture of your applications' inner workings so you can make sure they're performing as they should. APM tools make it easier for developers to spot issues that are preventing their applications from providing outstanding user experiences. Furthermore, these monitoring services can help to limit the danger of fatal outages and downtime, which can be extremely costly for any company.


