Operations | Monitoring | ITSM | DevOps | Cloud

October 2021

Kubernetes Monitoring Resources

Heaven knows we all could use some luck these days, and observability may be just the thing we need. But observability isn’t luck, and it isn’t really new either. A few people even know that observability is an aspect of control theory, which dates back to the 1800s! In this blog post, I’ll cover some of the history of observability vs.

Dash 2021 Keynote

The Datadog team deliver the annual Dash keynote. At Dash 2021, we announced new products and features that give your team even greater visibility into the health and performance of your code, databases, CI/CD pipelines, and more. Now, you can monitor network devices, get visibility into your services' golden signal metrics without touching a single line of code, and integrate third-party tools into our platform with Datadog Apps. We expanded RUM to include iOS error tracking, Session Replay, and Watchdog Insights. And we introduced Datadog Observability Pipelines, which run on your infrastructure and put you in control of your observability data, from how it’s processed to where it’s sent.

Roundtable: The Complexities of Cloud Migration - Dash 2021 (Datadog, LaunchDarkly, StockX)

Often when completing a migration project, you’re having your organisation straddle between two systems. You’re fighting habits and changing attitudes while also attempting to complete a high-risk operation. Every software team at one stage in their career will have to complete a migration. Whether it’s to improve scalability and performance, or transition between an on-prem to cloud solution, you’ll need a deep understanding of your current environment to create a strategy that minimises downtime for your team.

Observability for Service Organizations | Bart Scheltinga (RawWorks)

Observability is trending. Organizations that rely on cloud infrastructure and cloud applications prioritize observability initiatives to get control over their business’s applications. At the same time, we see the “gap” between the on-premises infrastructure and “non-cloud” infrastructure is becoming bigger. Examples are End User Computing (EUC) and Global networks (SD-WAN).

Metrics for Apache Kafka with Datadog and Aiven | Ryan Martin (Aiven)

Using managed services is all very well, but how do you get the data you need from the different services into Datadog so you can see it all in one place? This session will walk through the configuration for bringing your Aiven-managed Apache Kafka service metrics into your Datadog explorer. You’ll see how to filter the metrics to focus on specific topics or consumer groups, and how to use the Aiven client to create a repeatable, scriptable setup. This session is recommended for anyone living in the as-a-Service world who cares about data and is interested in using metrics to optimize their Kafka clusters.

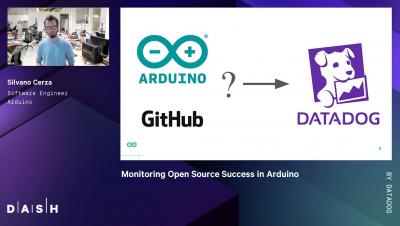
Monitoring Open Source Success in Arduino | Silvano Cerza (Arduino)

Arduino is an open-source hardware and software company, project, and user community that designs and manufactures single-board microcontrollers and microcontroller kits for building digital devices. In the course of developing software downloaded and used by millions around the world, we have found it vitally important to be aware of the quality and performance of our software.

Streaming Auth0 Logs to Datadog | Sivamuthu Kumar (Computer Enterprises, Inc.)

Are you using Auth0 in your application for user logins? How will you monitor the Auth0 logs and detect user actions that could indicate security concerns? In this session, we will see how Datadog helps you to extend security monitoring by analyzing Auth0 User activities in the logs. And also we will see how to set up threat detection rules to trigger notifications automatically based on them.

Democratizing Delivery: Seamless Observability for Optimal Application Performance |Ekim Maurer(NS1)

When application delivery performance issues happen, observability is critical to diagnosing the problem at hand. The adage “it’s always DNS” means that observability must extend to the foundational layers of the application delivery and access networking stacks. Yet granting administrative access to core network services like DNS and DHCP may run contrary to an organization’s least-privileged access policies. In this session, attendees will learn how global internet companies and enterprises use NS1 and Datadog to provide democratized DNS observability and reach optimal application performance.

What Is Synthetic Monitoring?

Fully functioning sites, stores, and backend systems are essential for attracting customers, delivering services, and managing operations internally. Every organization’s systems and processes have a direct impact on its business, revenues, and reputation. IT performance monitoring should strive to ensure that the systems and processes of any organization operate correctly, round the clock.

What is RMM (Remote Monitoring Management)?

We’re gradually shifting more to working remotely. And, the number of companies embracing remote and hybrid workforces in the wake of the pandemic is a substantial proof. Nevertheless, several organizations do face varied challenges from welcoming these conventional IT solutions as switching to these initiatives tend to seem quite tedious.

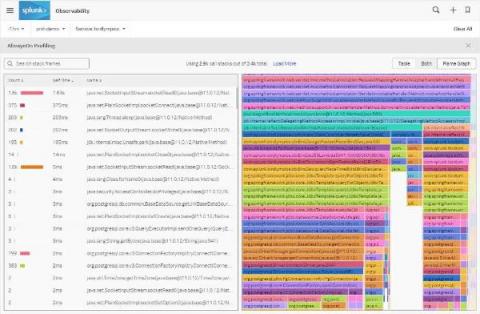
Announcing the Preview of Splunk APM's AlwaysOn Profiling

For application developers and service owners who build and troubleshoot modern enterprise software, resolving production issues requires identifying poor performance across multiple networks, operating systems, servers, configs, and third party dependencies. When the problem is the code itself, code profiling helps identify service bottlenecks by periodically taking CPU snapshots, or call stacks, from a runtime environment.

Going Beyond Observability with Rollbar and Datadog

In this webinar, we explore some of the common objectives shared by users of both Datadog and Rollbar and how best to accomplish those goals. Datadog provides comprehensive observability covering a large swath of services and components, while Rollbar’s advanced intelligence and code improvement features help to make code insights more actionable and easily fixable.

5 Business Insights to Gain From APM

With soaring demand on digital infrastructures, increasing deployment of B2B and B2C custom applications, and ever-tightening budget constraints, it’s more important than ever to ensure service delivery in a cost-effective manner. Delays experienced by your business partners and customers mean higher costs, lost revenue, and lost market share at a time when you can least afford it. In effect, slow is the new down.

How To Monitor Network Traffic

In today’s digital world, almost every business is driven by technology, whether big or small. With the advancement of technology, the associated threats to the security of the IT infrastructure come hand in hand. Therefore, businesses need network traffic analysis tools to keep an eye on their network. Monitoring network traffic continuously gives a business the insight to optimize and manage performance, minimize attack surfaces, intensify security, and better manage its resources.

Top 5 APM Tools to Keep Your Application Healthy

Developing modern applications is harder than ever, with microservices and cloud deployment models making it harder to get things working than ever before. However, anyone who’s deployed an application knows that that’s just the beginning of the work. The biggest part comes later: ensuring it works correctly, with maximum efficiency and great performance.

Comparing Rails Application Performance Monitoring Tools

Monitoring an application’s performance is the basics of building a successful software product. With the popularity that Rails has always been riding on in the start-up world, it makes all the more sense to look for tools that help you keep your Ruby on Rails application in shape. In this guide, we will look at some of the top APM tools for Rails applications and compare them along some standard benchmarks to help you get an insight into which tool fits your use case the best.

Understand the End-User Experience With Holistic Monitoring

You’re expected to monitor the entire end-user experience, so you need to be able to do it all. SolarWinds can help. Together, SolarWinds Web Performance Monitor (WPM) and SolarWinds Pingdom can give you the holistic monitoring you need, especially with the recent integration we’ve announced. While WPM monitors the experience of the end users behind your firewall, Pingdom monitors the customers and prospects on the outside of it. With WPM and Pingdom, you can have a holistic view of the performance and availability of your various applications. We’ll show you the benefits of adding SolarWinds Pingdom, including the following.

What is Digital Experience Monitoring?

Businesses globally have been steadily shifting to digital as early as a decade ago. With the coronavirus pandemic happening, the digital transformation has now shifted into fifth gear. Digital experience is the key to business success. As of 2020, there were almost 30 billion end users that’s connected to the internet. Digital revenue has increased dramatically and digital will surely drive retail sales up.

Sponsored Post

Build successful React Native apps with Raygun

React Native has come a long way since an internal prototype at Facebook to where it is now. The cross-platform framework is now a go-to tool for businesses to develop natively rendered mobile apps for iOS and Android. Thanks to its reduced development time with hot reloading to its focus on runtime performance with natively rendered views, React Native has gained traction with large-scale companies like Shopify and Tesla. Web developers have made the leap from the browser to mobile bringing with them all of their tools and expertise, and it is consistently the most popular cross-platform framework.

Metrics Dashboard, Scale testing upto 500K events/sec - Signal 05

A month and thousands of code lines later, we're here with our monthly product update - Signal #05. We squashed bugs, shipped custom metric dashboard along with improvisations in our frontend. We also got featured by one of the top online analytics magazines as one of the leading Data Observability platforms. 🥳 Let's dive in to see what humans at SigNoz have been up to!

Latest top 21 APM tools [open-source included]

Application Performance Monitoring (APM) tools are a critical component of distributed applications now. But choosing the right APM tool can be tricky. In this article, we go through a list of the top 21 APM tools including open-source APM tools which can help monitor and improve your application performance.