Operations | Monitoring | ITSM | DevOps | Cloud
April 2022
Using AI & ML for Application Performance (APM)
Today, IT and site reliability engineering (SRE) teams face pressure to remediate problems faster than ever, within environments that are larger than ever, while contending with architectures that are more complex than ever. In the face of these challenges, artificial intelligence has become a must-have feature for managing complex application performance or availability problems at scale.
Full-Cycle Observability With Dynatrace and Lightrun
Getting a good grasp on your application, especially when it is distributed across multiple clouds, kubernetes clusters and serverless functions is not an easy fit.
Azure AD Monitoring
As the Azure cloud administrator, you need to know who is accessing your cloud resources, how they are access it, what they access, what changed, when they access and from where, etc? Azure AD (Azure Active Directory) provides answers to above by storing the information in two logs, the information stored in them is extremely valuable for troubleshooting, monitoring and for general security related work, the logs are.
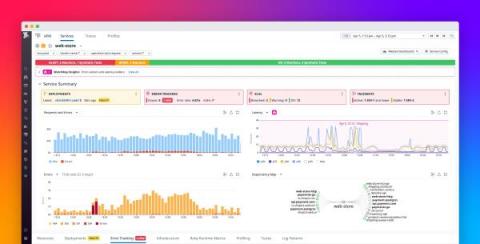
Explore a centralized view into service telemetry, Error Tracking, SLOs, and more
When your service is undergoing performance issues, it is essential to address them in a timely and frictionless manner. With access to more telemetry and insights, the APM Service Page provides a comprehensive overview of your service and helps you quickly drill down under the hood to diagnose and investigate issues.
Top 10 Requirements of Cloud Monitoring Tools
Most organizations are moving applications and workloads to the cloud. Our APM survey found that 88% of organizations had some form of cloud technology deployed already. At the same time, there are several misconceptions about the cloud. There are many who believe they don’t need monitoring tools for the cloud because their cloud provider will take care of all of their performance needs. This is a myth because cloud provider SLAs are mainly around infrastructure availability.
Lock Down Business Transactions
Why is Application Performance Monitoring Important?
Picture this: Your on-call engineer gets an alert at 2 AM about a system outage, which requires the entire team to work hours into the night. Even worse, your engineering team has no context of where the issue lies because your systems are too distributed. Solving the problem requires them to have data from resources that live in another timezone and aren’t responsive. All the while, your customers cannot access or interact with your application, which, as you can imagine, is damaging.
Implementing OpenTelemetry in Angular application
Amazon AppStream 2.0 vs Amazon WorkSpaces
Amazon offers two different services, Amazon WorkSpaces and AppStream 2.0, that can be used to deliver apps remotely either streamed via a browser or within a virtual workspace (desktop). Once you understand the differences between the two services the choice is usually clear from the use case. It is in fact common for organizations to use a mixture of both.
Application Performance Monitoring vs Application Performance Observability
You’ve likely heard the term Observability lately. There’s a fundamental change taking place in the Monitoring space, and Observability is behind it. Observability itself is a broad topic, so in this post we’ll talk about what it means to move from Application Performance Monitoring to Application Performance Observability.
Benefits of using an Application Performance Monitoring solution in Banks & How can banks optimize their performance using an APM tool?
Debug JavaScript in Mobile Safari (iOS) in 8 easy steps
Five Key Monitoring Capabilities for Top Payment Gateway Performance in E-commerce Applications
Payment gateway outages and performance issues have a disruptive effect on your business. When customers cannot complete a transaction, it leaves them frustrated and anxious. Even if it is not an outright outage, customers are wary of a flaky payment experience. They are often reluctant to retry the transaction for fear of being charged twice. This results in abandoned purchases and lost revenue.
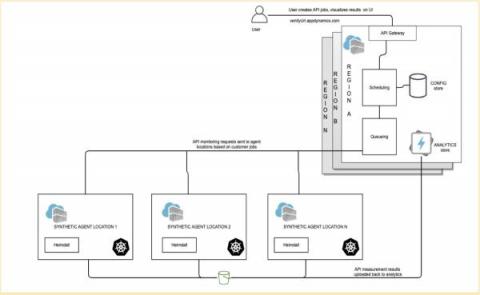
Synthetic API Monitoring brings proactive monitoring to modern microservices environments
Learn how AppDynamics can help you proactively monitor the availability and performance of your APIs.
Angular Instrumentation - Monitor your Angular application with Opentelemetry and SigNoz
OpenTelemetry and Jaeger | Key concepts, features, and differences
SigNoz - Open-source alternative to New Relic
How to Identify Memory Leaks
You may not be familiar with thinking about the memory usage of your applications as a software developer. Memory is plentiful and usually relatively fast in today's development world. Likely, the programming language you're using doesn't require you to allocate or free memory on your own. However, this does not mean you are safe from memory leaks. Memory leaks can occur in any application written in any language. Sure, older or "near to the metal" languages like C or C++ have more of them.
AppDynamics for OpenTelemetry: Accelerating innovation across software development ecosystems
AppDynamics for OpenTelemetry™ is future-proofing your digital transformation technologies' health and performance to maximize impacts.
Observe what matters with AppDynamics (in 30-seconds)
Crossed 6k+ GitHub stars, enabled S3, better dashboards and webhooks - SigNal 11
PEXA's John Natsioulas talks cloud migration
Learn how transitioning to AWS and AppDynamics is helping this team revolutionize the way property is bought and sold in Australia.
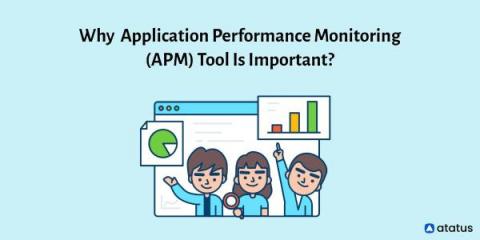
Why Application Performance Monitoring (APM) Tool Is Important?
Modern applications must deliver not only value but also round-the-clock availability, quick replies, and real-time problem-solving in today's digital economy. Since all businesses rely on software applications, their performance is one of their primary worries and frustrations, especially if their applications are the business itself. This is where Application Performance Monitoring Tool enters the scene.
What is IaC?
I recently had a wonderful opportunity to contribute to the Computer Weekly Developer Network (CWDN) ultimate series on “Infrastructure as Code” that collected articles and overviews from vendors and experts operating in the IaC space to form a formidable reference on all aspects of IaC. My contributions were to offer some insight into our architecture that has been designed to monitor infrastructure that has been deployed as code automatically and without tedious manual configuration.


