Operations | Monitoring | ITSM | DevOps | Cloud
February 2023
This Month in Datadog: Library Injections in K8s, Visibility into OTel-Instrumented Apps, and more
How to manage a containerized .NET app on Azure App Service with Elastic APM
Using Nerdio Manager to Deploy eG Enterprise for AVD Monitoring: A Quick Start Guide
eG Enterprise is designed to be deployed automatically at scale within IaC type workflows and by products such as Nerdio Manager that facilitate automation. Deployment of eG Enterprise can be automated with or without Nerdio Manager. Many of our customers do choose Nerdio Manager to automate other workflows and to create and manage images for Azure Virtual Desktop (AVD) deployments.
OpenTelemetry Nginx Tutorial - Instrument and visualize traces
OpenTelemetry Architecture - Understanding the design concepts
Discovering Efficiency Through 2 Steps Synthetic Monitoring for Splunk
You're probably familiar with Splunk. It's one of the most popular big data solutions organisations worldwide use to monitor their systems in real-time. But you may not know that Splunk also offers synthetic monitoring solutions via 2 Steps. 2 Steps Synthetic Monitoring for Splunk is a powerful tool that can help you speed up your application troubleshooting process. Today we'll take a closer look at what it is and how it can benefit your organisation.
Raygun API Beta is now open to everyone
Integrate eG Enterprise with Multiple ITSM Tools at the Same Time
Previous versions of eG Enterprise limited the eG Manager integration to a single ITSM system such as ServiceNow ITSM, Autotask, JIRA or others. This limitation was particularly cumbersome for SaaS and MSP (Managed Service Provider) deployments where each tenant/customer may have had their own preferred ITSM system. Our latest release lifts this restriction. ITSM integration can now be done for a specific Organization, Organizational Unit, or even User.
Understand user journeys with AppDynamics Business iQ
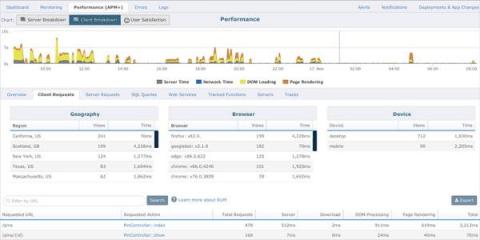
What is Retrace Application Performance Monitoring (APM)?
AI & Application Performance Monitoring Opportunities & Challenges
In today’s fast-paced world, app performance equals brand reputation. Customers expect apps that are fast, responsive and available 24/7. That’s where Application Performance Monitoring (APM) comes in. The technology enables businesses to ensure the best possible user experience by monitoring and managing the performance of their applications. But as applications become increasingly complex, identifying and resolving performance issues in real-time becomes increasingly difficult.
eG Enterprise rated the No. 1 APM Tool for Customer Experience by SoftwareReviews
The reviews are in! We are thrilled that eG Enterprise has been recognized by SoftwareReviews, a division of Info-Tech Research Group, as a Champion in the 2023 Application Performance Management – Enterprise (APM) Tools Emotional Footprint Buyer’s Guide. Moreover, eG Enterprise APM was ranked in the top spot out of 14 vendor solutions.
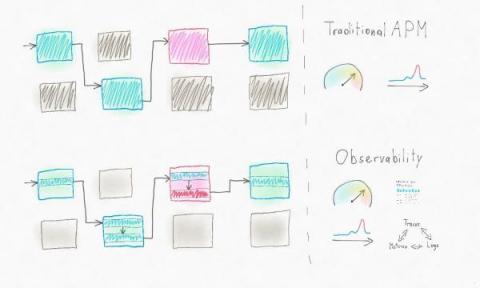
Observability vs Monitoring - The difference explained with an example
Trace-based testing with Elastic APM and Tracetest
This post was originally published on the Tracetest blog. Want to run trace-based tests with Elastic APM? Today is your lucky day. We're happy to announce that Tracetest now integrates with Elastic Observability APM. Check out this hands-on example of how Tracetest works with Elastic Observability APM and OpenTelemetry! Tracetest is a CNCF project aiming to provide a solution for deep integration and system testing by leveraging the rich data in distributed system traces.
Loki vs Prometheus - Differences, Use Cases, and Alternatives
Datadog Continuous Testing: Release with Confidence
4 Azure Load Balancer Metrics to Monitor
An Azure Load Balancer is a Layer-4 (TCP, UDP) load balancer that provides high availability by distributing incoming traffic among healthy VMs. A load balancer health probe monitors a given port on each VM and only distributes traffic to an operational VM. Azure Load Balancers are frequently used in Azure Virtual Desktop (AVD) deployments. From our work with Azure Load Balancer, we think there are 4 key metrics and events you should proactively monitor and alert on.
AppDynamics monitoring for SAP solutions overview
How Datadog Log Management Helps Customers Scale to Meet Their Needs
Complete Guide on Docker Logs [All access methods included]
How MSPs can Capitalize on the Rush for Localization of IT Services
“If you are a managed service provider (MSP) in Switzerland, your customers are very likely Swiss customers, so they speak the local language, and they want their data to be in Switzerland, and they want your service provider to comply with all the Swiss regulations. And the same is true in 190 other countries, especially after last year,”
Guide on Structured Logs [Best Practices included]
How Datadog APM Helps Klarna Deliver a Premium Customer Experience
Winston Logger - Full tutorial with a sample Nodejs application
Advanced filtering capabilities, Logs performance benchmark, and front page of HN - SigNal 21
Variable Chaining in Dashboards Demo - SigNoz
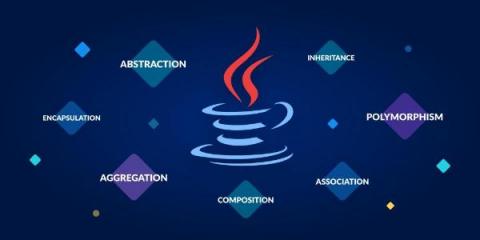
Using OOP concepts to write high-performance Java code (2023)
The complete guide to error monitoring and crash reporting
How to install the Site24x7 APM Insight Node.js agent
How to verify the license key for a .NET application
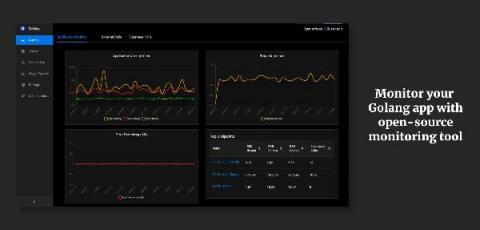
How to set up Golang application performance monitoring with open source monitoring tool - SigNoz
In this article, learn how to setup application monitoring for Golang apps using an open-source solution, SigNoz. If you want to check our Github repo before diving in 👇 Scalability, Reliability, Maintainability... The list goes on for the benefits of microservices architecture in today's world. But along with these benefits also comes the challenges of complexity.
The role of APM and distributed tracing in observability
Supporting Key Business Applications in the Cloud is Challenging: A Real-World Case Study
These days, many IT executives believe that it is easier to deploy applications in the cloud than on-prem. They are also often under the misconception that once an application is hosted in the cloud, it is the responsibility of the cloud service provider to maintain the availability and performance of the application.
10 Best RUM Tools for Improving Your User Experience
Having user-friendly programs is paramount for any software company’s success. To gain a better understanding of your users’ experience and enjoyment, it’s vital that you learn how customers interact with your app or website. Real user monitoring (RUM) solutions enable your company to visualize how users interact with your software, helping you learn what works best for your customers so you can thrive against the competition.


