Operations | Monitoring | ITSM | DevOps | Cloud
April 2021
Dashboard Anything - Deep Dive of Dashboard Server
Customer Spotlight - Award for Outstanding Dashboard
Product Training - How to Dashboard Azure Costs and Resources
SquaredUp 5.1 is here
We are delighted to announce that SquaredUp 5.1 is now available! With this latest update, we are introducing new integrations and visualizations that extend the picture of your business services and applications by unlocking even more of your data that is trapped within silos. You can now get insights on your enterprise applications from any angle! These features are available in all our products, including our newest product Dashboard Server.
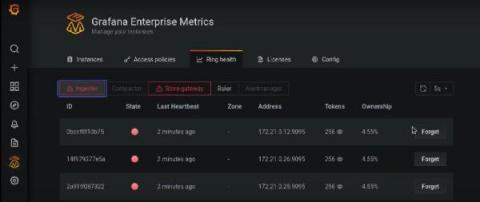
What's new in Grafana Enterprise Metrics 1.3, our scalable, self-hosted Prometheus service
We built Grafana Enterprise Metrics (GEM) to empower centralized observability teams to provide a multi-tenanted, horizontally scalable Prometheus-as-a-Service experience for their end users. The GEM plugin for Grafana is a key piece of realizing this vision. It provides a point-and-click way for teams operating GEM to understand the state of their cluster and manage settings for each of the tenants within it.
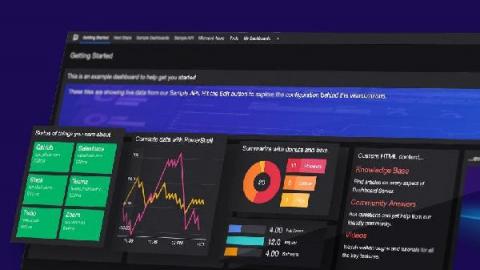
Dashboard Server: Working with the SQL tile
In my previous blogs in the Dashboard Server Learning Path, we looked at working with the Web API tile and the PowerShell tile. In this instalment, let’s try the SQL tile. This tile will let you connect to any SQL database and run a SQL query straight from SquaredUp. This tile is also available in both the SquaredUp for SCOM and Azure products, so I have some familiarity with it already.
Dashboard Server - Introduction
Dashboard Server - Create your first dashboard
Dashboard Server - Visualising from an API
Dashboard Server - Share with Open Access
Get instant Grafana dashboards for Prometheus metrics with the Elixir PromEx library
I have been using Grafana for almost four years now, and in that time it has become my go-to tool for my application observability needs. Especially now that Grafana allows you to also view logs and traces, you can easily have all three pillars of observability surfaced through Grafana. As a result, when I started working on the Elixir PromEx library, having Grafana be the end target for the metrics dashboards made perfect sense.
Benchmarking Grafana Enterprise Metrics for horizontally scaling Prometheus up to 500 million active series
Since we launched Grafana Enterprise Metrics (GEM), our self-hosted Prometheus service, last year, we’ve seen customers run it at great scale. We have clusters with more than 100 million metrics, and GEM’s new scalable compactor can handle an estimated 650 million active series. Still, we wanted to run performance tests that would more definitively show GEM’s horizontal scalability and allow us to get more accurate TCO estimates.
How PayIt, a secure cloud service provider for digital government, uses Grafana and Prometheus for observability at cloud native scale
A trip to the DMV — and a realization that there had to be a better, more modern way for the system to work — sparked the idea for PayIt, a secure cloud service provider for digital government that launched in 2013. The company’s mission is to help state, local, and government agencies reach their constituents better and more effectively, shifting the reliance from in-office payments to digital ones.
Dashboard Server: Working with the PowerShell tile
Amongst all the cool features of SquaredUp Dashboard Server, the coolest kid on the block is probably the PowerShell tile. The reason is simple – PowerShell is easy, it’s awesome, and it’s powerful! You can not only retrieve data from the source (like the APIs), but you can also manipulate that data, work with variables, loop it, filter it, and use it in whichever way works the best. Like they say, the things PowerShell can do are only restricted by the proficiency of the user.
We've added first-class Windows support to Grafana Agent
The Grafana Agent team is happy to announce that Grafana Agent 0.14.0-rc2 includes improved Windows support. Up until now, running Grafana Agent — our tool for gathering metrics, logs, and traces — in Windows was difficult and not well supported for Windows best practices. In short, it was not a good Windows citizen. In the new release candidate, we’re making changes to improve the experience, based on feedback from GitHub issues, customer contacts, and our own experience.
Trying Out OpenSearch with Logz.io
I’m excited to see our vision for an open source path forward for Elasticsearch and Kibana taking shape with OpenSearch! Since Elastic announced its intent to close-source Elasticsearch and Kibana, we’ve been working in full gear to have an open source path forward for these projects. This is our commitment to our users, this is our commitment to the community. We’ve collaborated with AWS and others to fork Elasticsearch and Kibana and create OpenSearch.
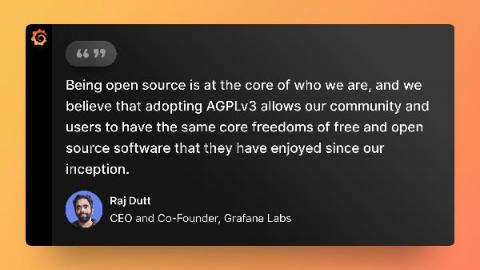
Q&A with Grafana Labs CEO Raj Dutt about our licensing changes
When Grafana Labs CEO and co-founder Raj Dutt announced to the team that the company would be relicensing our core open source projects from Apache 2.0 to AGPLv3, he opened the floor for discussion and encouraged anyone who had further questions to reach out. We believe in honesty and transparency, so we collected hard questions from Grafanistas, and Raj answered them for this public Q&A. The time felt right. As I’ve said publicly before, I’ve been thinking about this topic for years.
Grafana, Loki, and Tempo will be relicensed to AGPLv3
Grafana Labs was founded in 2014 to build a sustainable business around the open source Grafana project, so that revenue from our commercial offerings could be re-invested in the technology and the community. Since then, we’ve expanded further in the open source world — creating Grafana Loki and Grafana Tempo and contributing heavily to projects such as Graphite, Prometheus, and Cortex — while building the Grafana Cloud and Grafana Enterprise Stack products for customers.
Dash Studio: Building time-based comparison dashboards
The benefits and challenges of a single pane of glass
SCOM 2019 is a monitoring powerhouse. Its capabilities are unmatched. But it also has some serious issues when it comes to unearthing and visualizing the valuable data locked inside. The replacement of Silverlight with HTML5 in the SCOM 2019 web console was a welcome enhancement, but the SCOM web console still shares its design with the administration console, which is slow, complex, and makes it downright difficult to get the visibility you need.
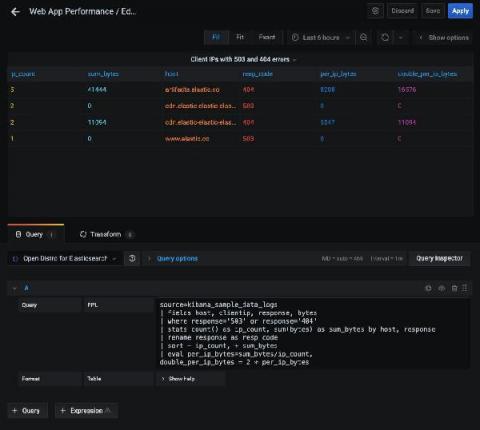
Introducing the new Open Distro for Elasticsearch plugin for Grafana, also available in Amazon Managed Service for Grafana
Back in December, Amazon Web Services (AWS) and Grafana Labs partnered to launch the Amazon Managed Service for Grafana in a preview to a limited set of customers. Amazon Managed Service for Grafana is a scalable managed offering that provides AWS customers a native way to run Grafana directly within AWS alongside all their other AWS services.
How to build insightful M365 Analytics Dashboards with SquaredUp and Microsoft Graph API (Part 2)
In the last blog post, I walked you through how to connect to the Microsoft Graph API so you can start pulling in the M365 analytics to create a dashboard in SquaredUp. In this blog post, I’ll walk you through exactly how to create this dashboard. This dashboard will allow you to monitor key metrics for Microsoft 365 SharePoint, Exchange Online, and Teams so you can be proactive in assigning storage.
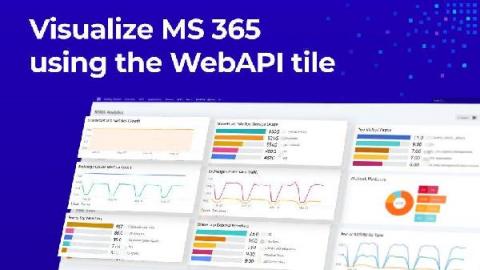
Dashboard Server: Working with the WebAPI tile
Now that we’ve familiarized ourselves with the basics, let’s get on creating our first dashboard! I spot an familiar tile here, the WebAPI tile. This tile is available in the SquaredUp SCOM and Azure products too. WebAPI tile is the way you bring external data into SquaredUp. As long as the tool you’re connecting to has an API endpoint that returns data in JSON payload, you can work with that data to display the data in a dashboard in SquaredUp.
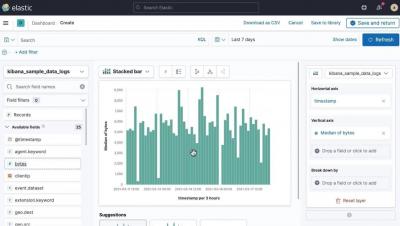
Building Kibana dashboards more efficiently
Creating dashboards is quicker and easier than before with a new streamlined navigation experience, now available in Kibana 7.12. This dashboard-first approach makes it simple for you to create and add visualizations without leaving your dashboard-building flow. Get started directly from a Kibana dashboard with a few simple steps: Select Create Panel and choose what type of visual you want to build.
How to build insightful M365 Analytics Dashboards with SquaredUp and Microsoft Graph API (Part 1)
It’s incredibly helpful to be able to visualize the data produced by your organization’s M365 tenant so you can manage licenses, usage, capacity, and more. SquaredUp dashboards are ideal for this. You can use the WebAPI Tile in SquaredUp to connect to the Microsoft Graph API, which offers a broad set of functionalities for working with Azure via code. Microsoft 365 sits on top of Azure and can be managed via Graph API, too.
Easily monitor your Tencent Cloud services with the new Grafana plugin
Plugins make it easier for Grafana users to get faster time to value. With a few clicks, you can start tapping into the different data stores you and your business already leverage — and see them all in one place in your Grafana dashboard. I’m a huge fan of partner-developed plugins for a few reasons, with my favorite being subject matter expertise. Who better to develop your plugin than the team that knows the product inside out?
How to Collect and Visualize Windows Events From 5 Hosts in 5 Minutes
If you’re investigating incidents on your Windows hosts, sifting through the Event Viewer can be a painful experience. It’s best to collect and ship Windows Events to a separate backend for easier visualization and analysis – but depending on the solution you choose, this can take some significant legwork. Often, this can require manually configuring a 3rd party tool or agent, just to get started.
Building your first visualization with Kibana Lens
Announcing OpenSearch: Doubling Down on Open Source
Today, I’m excited to officially announce our support for the OpenSearch project, the new fork of the Elasticsearch and Kibana codebases. As we previously shared, Logz.io has the utmost commitment to its customers and the community to ensure that these open-source technologies will prosper by being built for the community and guided by the community.
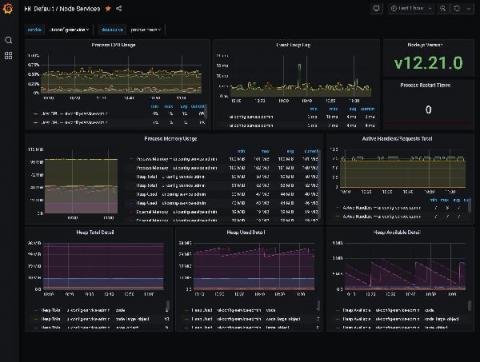
How we use metamonitoring Prometheus servers to monitor all other Prometheus servers at Grafana Labs
One of the big questions in monitoring can be summed up as: Who watches the watchers? If you rely on Prometheus for your monitoring, and your monitoring fails, how will you know? The answer is a concept known as metamonitoring. At Grafana Labs, a handful of geographically distributed metamonitoring Prometheus servers monitor all other Prometheus servers and each other cross-cluster, while their alerting chain is secured by a dead-man’s-switch-like mechanism.
Using NoSQL Databases as Backend Storage for Grafana
Grafana is a popular way of monitoring and analysing data. You can use it to build dashboards for visualizing, analyzing, querying, and alerting on data when it meets certain conditions. In this post, we’ll look at an overview of integrating data sources with Grafana for visualizations and analysis, connecting NoSQL systems to Grafana as data sources, and look at an in-depth example of connecting MongoDB as a Grafana data source.
Using Telegraf plugins to visualize industrial IoT data with the Grafana Cloud Hosted Prometheus service
One of the biggest challenges with data visualization for complicated software systems is getting quick access to the underlying data and connecting it to some form of cloud-hosted solution. Traditionally it has required quite a bit of middleware and upfront setup with additional tooling.
Splunk > Clara-fication: Dashboarding Best Practices
So you want to build a better dashboard, do you? Well good, you’ve come to the right place! Splunk dashboards are amazing. They are incredibly versatile and customizable. The creation of a dashboard is incredibly simple and can be done all through the UI. If more in-depth customization is required, that can be done through the SimpleXML using HTML panels, in-line CSS, or by uploading a new app from Splunkbase or custom JS/CSS.
Discover in Kibana uses the fields API in 7.12
With Elastic 7.12, Discover now uses the fields API by default. Reading from _source is still supported through a switch in the Advanced Settings. This change stems from updates made to Elasticsearch in 7.11 with the extension of the Search API to include the new fields parameter. When using the new search parameter, both a document’s raw source and the index mappings to load and return values are used.


