Operations | Monitoring | ITSM | DevOps | Cloud
March 2023
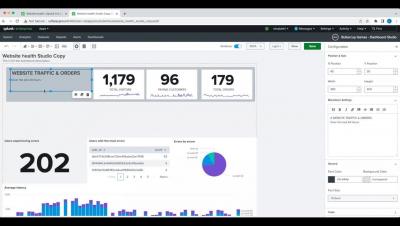
Splunk Dashboard Studio Demo in Splunk 9.0
Reduce compliance TCO by using Grafana Loki for non-SIEM logs
Compliance is a term commonly associated with heavily regulated industries such as finance, healthcare, and telecommunication. But in reality, it touches nearly every business today as governments and other regulatory agencies seek to enact tighter controls over the use of our collective digital footprint. As a result, more and more companies need to retain a record of every single digital transaction under their control.
A year in Mimir: Massive scale, new metrics formats, increased adoption
When we introduced Grafana Mimir into the open source ecosystem, we weren’t shy about our ambitions. Once we got past answering some of the easier questions (For the record, the name Mimir comes from Norse mythology, and it’s pronounced /mɪ’mir/.), we quickly got to work making good on our promise to deliver the most scalable, most performant open source time series database (TSDB) in the world.
How Geometric Search Works for Hexagons in Elasticsearch
Kibana Demo of Hexagonal Clusters
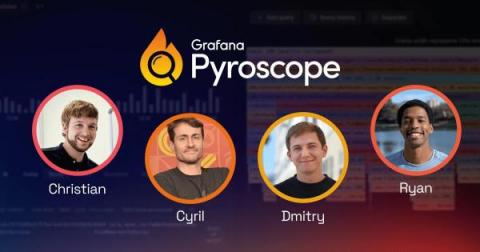
Meet the minds behind Grafana Pyroscope: Christian, Cyril, Dmitry, and Ryan
What do you get when you combine the wit, wisdom, and weird humor of four talented tech minds? As it turns out, a surprisingly lively Q&A! As Grafana Pyroscope emerges from the union of Grafana Phlare and Pyroscope, it’s time to really get to know the people behind these continuous profiling projects. That’s why we brought together the Pyroscope founders, Dmitry Filimonov and Ryan Perry, and Phlare technical leads, Cyril Tovena and Christian Simon, for this light-hearted conversation.
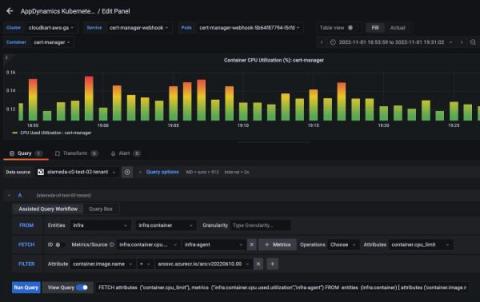
AppDynamics Cloud integrates with Grafana to add key metrics for dashboards
AppDynamics Cloud releases the first (and only) vendor provided free plugin for GrafanaⓇ OSS. Widely adopted by DevOps, SREs and developers, Grafana has become the go-to dashboarding tool among users—including our own internal teams. As such, Cisco AppDynamics has expanded support and use cases for Grafana by building an open-source integration for AppDynamics Cloud customers, absolutely free of charge!
New One-click Dashboard Templates in eG Enterprise v7.2
One-click dashboard templates are among a number of tools available within eG Enterprise to allow organizations to rapidly set up targeted and bespoke views for a wide range of audiences across their organizations, whilst avoid the costs and inconsistencies of building and maintaining many individual dashboards.
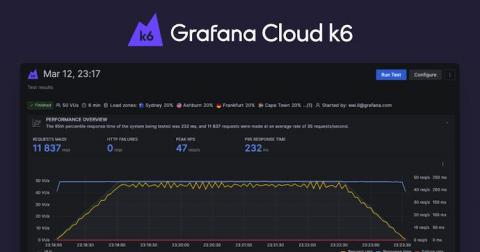
Introducing Grafana Cloud k6: unified performance testing and observability
Organizations use load and performance testing to prevent issues from impacting customers, which is essential if they want to stay relevant in today’s digital-first world. And with the rise of cloud native technology and DevOps, software teams must shift performance testing left, towards development. However, traditional load and performance testing tools simply haven’t kept pace, leaving developers, operations, and QA teams siloed.
Introducing Grafana Cloud k6
From fish tanks to data banks: finding Grafana on a farm
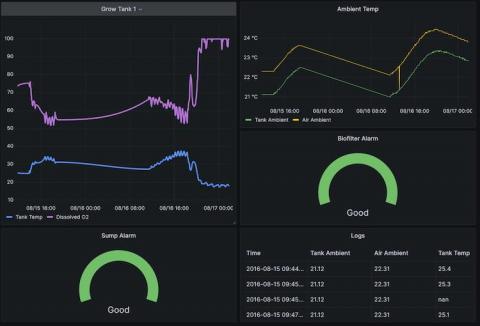
I started a fish farm because I realized that the three marine biologists in the world weren’t giving up their jobs. It was 2014 and I had just finished a degree in marine ecology, so it seemed like a good idea in my head. Of course, actually building and operating a fish farm — technically, an aquaponics farm — turned out to me much harder than I ever expected.
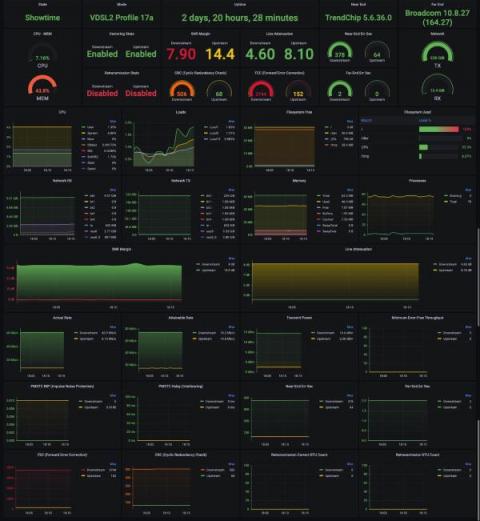
How to monitor an xDSL Modem using a Prometheus Exporter plugin and Grafana Agent on Grafana Cloud with Grafana OnCall
Furkan Türkal likes to design and implement new tech stacks with a deep focus on distributed and low-level systems. He is interested in contributing to open source projects, communities, and project management, and has a strong interest in the CNCF world! Recently, he has been doing research on Supply Chain Security. Hardware breaks, just like our hearts — and both can be due to complicated situations.
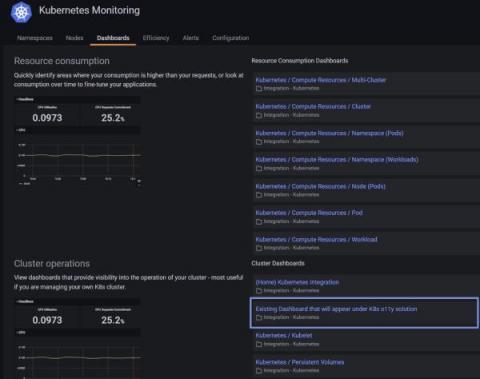
How to migrate existing Grafana dashboards and alerts into Kubernetes Monitoring in Grafana Cloud
Kubernetes Monitoring in Grafana Cloud is already an observability Swiss Army knife: You can monitor your Kubernetes fleet performance, nodes, pod logs, resource utilization, and overall infrastructure health all in one hosted platform that comes with prebuilt Grafana dashboards to visualize all the important telemetry you need. All of this sounds great … but what if you already have Grafana dashboards and alerts that are custom to your fleet and the way you do business?
Metrics vs. Logs vs. Traces (vs. Profiles)
In software observability, we often talk about three signal types - metrics, logs, and distributed traces. More recently I've been hearing about profiles as another signal type. In this article I will explain the different observability signals and when to use them in a clear and concise way.
Pyroscope and Grafana Phlare join together to accelerate adoption of continuous profiling, the next pillar of observability
We are happy to announce that Pyroscope, the company behind the eponymous open source continuous profiling project, is now part of Grafana Labs. With this acquisition, we will be merging the Pyroscope project and Grafana Phlare, the project we launched last year, under the new name Grafana Pyroscope. We first met the Pyroscope team, led by co-founders Ryan Perry and Dmitry Filimonov, as they were graduating from Y Combinator. Like Grafana Labs, they have open source in their DNA.
From Kubernetes Out Of Kubernetes Observability and Shifting left chaos testing
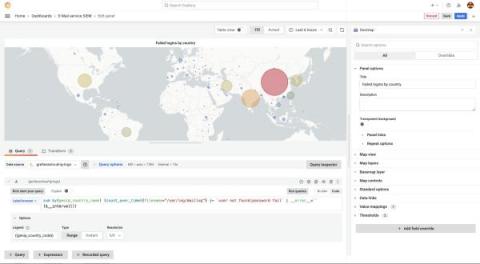
Protect PII and add geolocation data: Monitoring legacy systems with Grafana
Legacy systems often present a challenge when you try to integrate them with modern monitoring tools, especially when they generate log files that contain personally identifiable information (PII) and IP addresses. Thankfully, Grafana Cloud, which is built to work with modern observability tools and data sources, makes it easy to monitor your legacy environments too.
Grafana Agent v0.32 release: New integrations with Oracle, AWS, Microsoft Azure, and more
Grafana Agent v0.32 is now available! This release includes a host of new integrations for the Grafana Agent and components for Grafana Agent Flow so you can easily monitor your vital infrastructure. We’re also excited to announce that Flow is no longer in beta. Introduced last fall, Flow is a new configuration mode that makes Grafana Agent easier and more powerful to run.
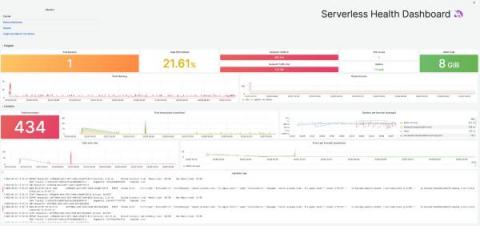
AWS Fargate monitoring: How to collect serverless logs, metrics, and traces in Grafana
Interoperability — it’s one of the main reasons I joined Grafana Labs. Our “big tent” philosophy helps Grafana work with a wide range of data sources and tools, and it’s why you can use Grafana to address endless use cases and problems. We are best known for the seamless way we correlate metrics, logs, and traces to understand what is happening in the environment, resolve the immediate issue, and address any underlying issues so that it does not happen again.
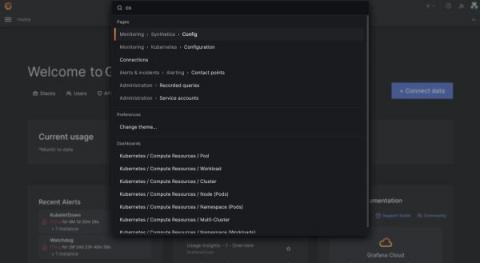
New in Grafana Cloud: Key improvements to the command palette and navigation experience
A new navigation experience will be rolled out in Grafana Cloud this month, with improvements designed to make Grafana more seamless to use. Along with updates in Grafana’s search and navigation, there is a new enhanced command palette that helps streamline workflows and allows you to move through the platform without even taking your hands off the keyboard.
5 key takeaways from the Grafana Labs Observability Survey 2023
Observability is coming into its own, as SREs and DevOps practitioners increasingly seek to centralize the sprawl of tools and data sources to better manage their workloads and respond to incidents faster — and to save time and money in the process. That was the overarching message from more than 250 observability practitioners who took part in the Grafana Labs’ first ever Observability Survey.
Out of the box PostgreSQL monitoring with InfluxDB and Grafana dashboards
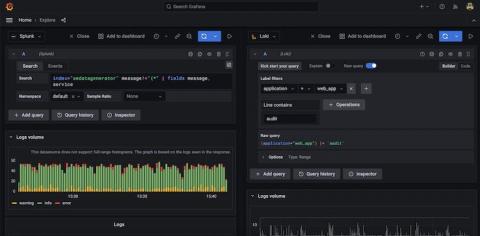
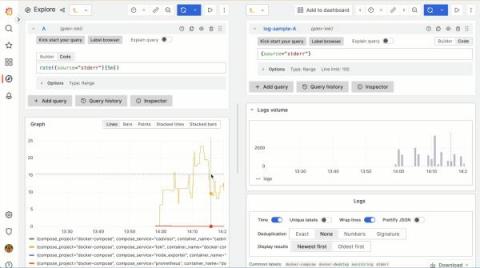
Write Loki queries easier with Grafana 9.4: Query validation, improved autocomplete, and more
At the beginning of every successful data exploration journey, a query is constructed. So, with this latest Grafana release, we are proud to introduce several new features aimed at improving the Grafana Loki querying experience. From query expression validation to seeing the query history in code editor and more, these updates are sure to make querying in Grafana even more efficient and intuitive, saving you time and frustration.
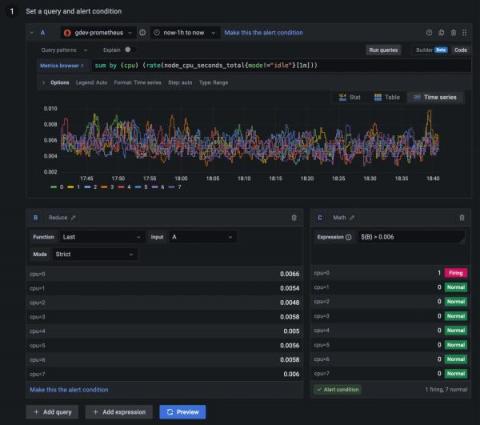
Grafana Alerting: 12 ways we made creating and managing alerts easier than ever
Since the release of Grafana 9.0, we have been listening to feedback for Grafana Alerting from both our customers and the Grafana community forums. We have heard many of your recommendations, suggestions, and frustrations and have made significant improvements to Grafana Alerting since it became generally available last year. Here at Grafana Labs, we are always striving to improve our product and provide the best possible experience for our users.
First Steps to Building the Ultimate Monitoring Dashboards in Logz.io
Cloud infrastructure and application monitoring dashboards are critical to gaining visibility into the health and performance of your system. But what are the best metrics to monitor? What are the best types of visualizations to monitor them? How can you ensure your alerts are actionable? We answered these questions on our webinar Build the Ultimate Cloud Monitoring Dashboard.
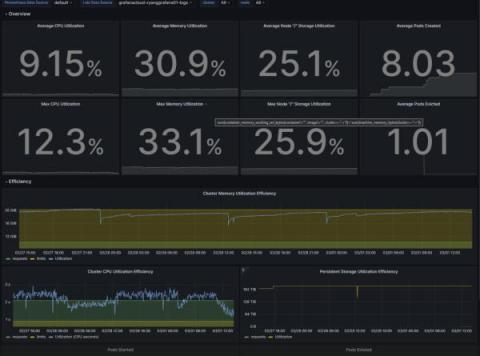
How to optimize resource utilization with Kubernetes Monitoring for Grafana Cloud
Overprovisioning or underprovisioning your Kubernetes resources can have significant consequences on both your budget and your app performance. By underprovisioning your Kubernetes infrastructure, you’ll end up with lagging, underperforming, unstable, or non-functional applications. On the opposite end of the spectrum, overprovisioning is a costly issue: Organizations spent almost $500 billion on cloud resources in 2022, yet an estimated 30% of those were wasted.
Public Dashboards, Incident Management, and Our New Analytics API
Late last year we announced improvements to our public dashboards that included a revamped dashboard design that allowed users to see monitoring data in a more easily-digestible way, on any device. We improved performance across the board, and also introduced new incident management functionality—available for paid plans only—that allows users to more easily communicate scheduled maintenance notices and alert developers to minor and major incidents.


