Operations | Monitoring | ITSM | DevOps | Cloud
July 2022
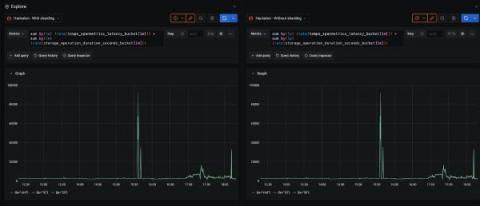
How Grafana Mimir helped Pipedrive overcome Prometheus scalability limits
Karl-Martin Karlson has been working on Pipedrive’s observability team for more than four years, implementing and supporting several observability platforms such as Grafana, Prometheus, Graylog, and New Relic. In sales, as in life, you can’t control your results — but you can control your actions. With that in mind, a team of sales professionals set out in 2010 to build a customer relationship management (CRM) tool that helps users visualize their sales processes and get more done.
An Introduction to B-Tree and Hash Indexes in PostgreSQL
Serverless Monitoring In The Cloud With The observIQ Distro for OpenTelemetry
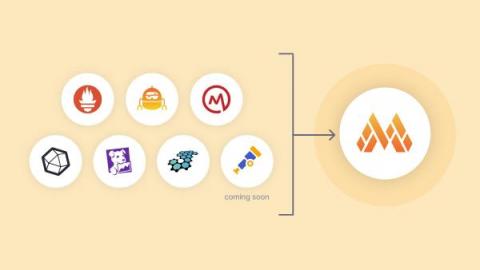
New in Grafana Mimir: Ingest Graphite, Datadog, Influx, and Prometheus metrics into a single storage backend
In March 2022, Grafana Labs released Grafana Mimir, the most scalable, most performant open source time series database in the world. Mimir provides significant scale — 1 billion active series and beyond — with easy deployment, multi-tenancy, durable storage, high availability, and super fast query performance. From launch, Grafana Mimir could natively consume Prometheus metrics.
Monitor CockroachDB performance metrics with Datadog
CockroachDB is a highly resilient distributed SQL database developed by Cockroach Labs. CockroachDB assures ACID semantics and aims to make it easy to scale horizontally by adding nodes instead of manually sharding the database. Built to be resilient (much like its namesake insect) and highly available as it scales, CockroachDB readily recovers from node failures by repairing and rebalancing automatically.
New Features and Enhancements in SQL Server 2022
Top 8 Database Version Control Tools
Many DevOps teams struggle to achieve consistent builds and releases due to ineffective collaboration and communication strategies. Over 71% of software teams today are working remotely from global locations, according to a survey by Perforce and DevOps.com. Interestingly, this consistency challenge can be easily solved by a simple approach – database version control.
How we improved Grafana Mimir query performance by up to 10x
Earlier this year we introduced the world to Grafana Mimir, a highly scalable open source time series database for Prometheus. One of Mimir’s guarantees is 100% compatibility with PromQL, which it achieves by reusing the Prometheus PromQL engine. However, the execution of a query in the Prometheus PromQL engine is only performed in a single thread, so no matter how many CPU cores you throw at it, it will only ever use one core to run a single query.
New Features and Enhancements in SQL Server 2022
How to create a Mimir managed alert rule in Grafana
For more info, go to:
Grafana Alerting page: https://grafana.com/grafana/grafana-alerting/
Grafana Alerting documentation: https://grafana.com/docs/grafana/latest/alerting/
Introducing Flyway Check for Changes and Drift Reports
DevOps Best Practices for Database
DevOps has been bridging the gap between the development and operations teams for more than a decade. It is eliminating the organizational barriers between the two and automates the delivery process. It's time to start treating databases the same way we treat the delivery pipeline when applying DevOps. When we have a large database, automation is crucial. When the database has too much information, changing a table can take ages and block further changes like inserts, updates, or deletes.
How to monitor Cassandra using OpenTelemetry
Redgate SQL Monitor - Monitor SQL server performance and availability
Tracing Gorm queries with OpenCensus & Google Cloud Tracing
At incident.io we use gorm.io as the ORM library for our Postgres database, it’s a really powerful tool and one I’m very glad for after years of working with hand-rolled SQL in Go & Postgres apps. You may have seen from our other blog posts that we’re heavily invested in tracing, specifically with Google Cloud Tracing via OpenCensus libraries.
Introducing VMware Tanzu GemFire for Redis Apps
The release of VMware Tanzu GemFire 9.15 introduces compatibility with the VMware Tanzu GemFire for Redis Apps add-on. This add-on enables compatibility between Redis applications and Tanzu GemFire for the first time ever, unlocking enterprise-ready features for your Redis applications.
PostgreSQL Logging Configuration Explained: How to Enable Database Logs
PostgreSQL is an open-source relational database management system that’s been utilized in continuous development and production for 30 years now. Nearly all the big tech companies use PostgreSQL, as it is one of the most reliable, battle-tested relational database systems today. PostgreSQL is a critical point in your infrastructure, as it stores all of your data. This makes visibility mandatory, which in turn means you have to understand how logging works in PostgreSQL.


