Operations | Monitoring | ITSM | DevOps | Cloud
March 2023
Database Monitoring: Ensuring Optimal Performance and Reliability
In today's world, where businesses are heavily reliant on technology, databases have become a crucial component of business operations. Databases are the backbone of any organization, containing vast amounts of data that is essential for smooth functioning. However, with the amount of data that databases store, it is not uncommon for them to encounter issues that could lead to downtime and data loss.
Redis on Cycle: Configuration and Deployment
Redis is a powerful in-memory data store thats blazing fast. It's performant, scalable, supports a wide range of data structures, has built in caching mechanisms, and is simple to set up for Cycle users. This post will take you from deploying your first Redis instance on Cycle, through deploying highly available, stateful Redis instances that are monitored by Redis Sentinel. The companion repo for this article with configuration files and settings can be found here.
A year in Mimir: Massive scale, new metrics formats, increased adoption
When we introduced Grafana Mimir into the open source ecosystem, we weren’t shy about our ambitions. Once we got past answering some of the easier questions (For the record, the name Mimir comes from Norse mythology, and it’s pronounced /mɪ’mir/.), we quickly got to work making good on our promise to deliver the most scalable, most performant open source time series database (TSDB) in the world.
Compactor: A Hidden Engine of Database Performance
This article was originally published in InfoWorld and is reposted here with permission. The compactor handles critical post-ingestion and pre-query workloads in the background on a separate server, enabling low latency for data ingestion and high performance for queries. The demand for high volumes of data has increased the need for databases that can handle both data ingestion and querying with the lowest possible latency (aka high performance).
Redis Monitoring with OpenTelemetry and SigNoz
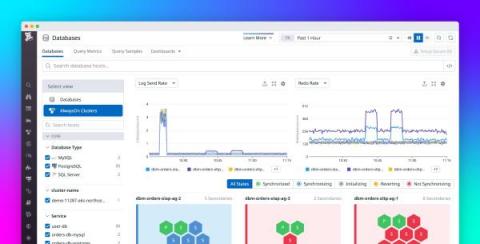
Monitor your AlwaysOn availability groups with Datadog Database Monitoring
SQL Server AlwaysOn availability groups provide database clusters that streamline automatic failovers and disaster recovery. With AlwaysOn clusters, you can leverage reliable, high-availability support for your services. However, AlwaysOn groups can be problematically complex, spread over servers and regions with multiple points of failure in each cluster. This makes it difficult to understand what’s happening in your groups at any given time and troubleshoot when issues occur.
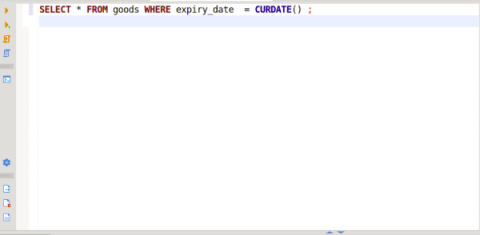
How to Get the Current Date and Time in SQL
SQL databases have several functions that reduce the complexity of working with date and time. Using these functions and a date and time type column, you can depend on SQL for the logic to write and read data with date and time. In this post, you’ll learn how to use the SQL date and time functions to get the current date and time.
How DevOps is shaping Financial Services #1: The role of governance
Why Glovo Chose Database Monitoring to Gain Context for Troubleshooting Issues
Flyway Desktop with PostgreSQL: demo
The High Cost of Poor Database Performance (It's Not Just Monetary)
Oracle Database monitoring: An administrator's guide
Oracle Database is known for its reliability, scalability, and outstanding performance. An enterprise-friendly feature catalogue makes it a go-to for companies that need data to be available across their disparate IT infrastructure. Large-scale enterprises relying on huge database systems like Oracle need to make sure that data transactions are hassle-free and demand is met with the resources available.
Deploy PostgreSQL services to multiple clouds and regions using Terraform
PostgreSQL vs. MySQL
Save network costs with VictoriaMetrics remote write protocol
Prometheus remote write protocol is used by Prometheus for sending data to remote storage systems such as VictoriaMetrics. See these docs on how to setup Prometheus to send the data to VictoriaMetrics. This protocol is very simple - it writes the collected raw samples into WriteRequest protobuf message, then compresses the message with Snappy compression algorithm and sends it to the remote storage in an HTTTP POST request.
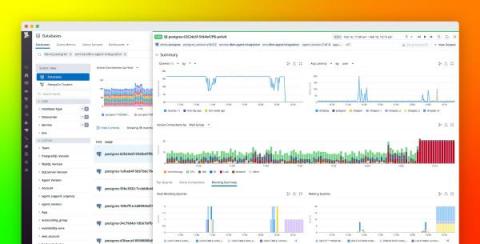
Troubleshoot blocking queries with Datadog Database Monitoring
Blocked queries are one of the key issues faced by database analysts, engineers, and anyone managing database performance at scale. Blocking can be caused by inefficient query or database design as well as resource saturation, and can lead to increased latency, errors, and user frustration. Pinpointing root blockers—the underlying problematic queries that set off cascading locks on database resources—is key to troubleshooting and remediating database performance issues.


