Operations | Monitoring | ITSM | DevOps | Cloud
November 2023
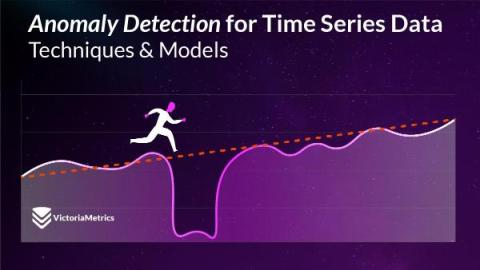
Anomaly Detection for Time Series Data: Techniques and Models
Welcome to the third chapter of the handbook on Anomaly Detection for Time Series Data! This series of blog posts aims to provide an in-depth look into the fundamentals of anomaly detection and root cause analysis. It will also address the challenges posed by the time-series characteristics of the data and demystify technical jargon by breaking it down into easily understandable language.
How to Monitor MongoDB Metrics with OpenTelemetry
Memcached Metrics Monitoring with OpenTelemetry
Managing Databases on AWS: A Practical Guide
Amazon Web Services (AWS) provides a range of managed database services that provide multiple database technologies to handle various use cases. They are designed to free businesses from tasks like database administration, maintenance, upgrades, and backup. AWS databases come in several types to cater to different business needs.
Monitoring Microsoft SQL Server login audit events in Graylog
Performance optimization techniques in time series databases: Limiting concurrency
This blog post is also available as a recorded talk with slides.
How to Monitor MySQL Metrics with OpenTelemetry
How to unlock your leadership potential on a cloud migration project: A guide for the DBA, part 2
Why every user can now fly first class with Flyway
Performance optimization techniques in time series databases: function caching
Relabeling is an important feature that allows users to modify metadata (labels) of scraped metrics before they ever make it to the database. As an example, some of your scrape targets may generate metric labels with underscores (_), and some of your targets may generate labels with hyphens (-). Relabeling allows you to make this consistent, making database queries easier to write.
How to unlock your leadership potential on a cloud migration project: A guide for the DBA, part 1
SolarWinds bolsters Database Observability for cloud-native platform
What is subsetting, what are the advantages, and how does it make test data management easier?
Getting started with PostgreSQL for SQL Server Developers | PostgreSQL 101
Comparing SQL Server and PostgreSQL | PostgreSQL 101
Why Databases Don't Cloud Well and What To Do About It by David Stokes - Navigate Europe 23
Performance optimization techniques in time series databases: strings interning
VictoriaMetrics is an open-source time-series database (TSDB) written in Go, and I’ve had the pleasure of working on it for the past couple of years. TSDBs have stringent performance requirements, and building VictoriaMetrics has taught me a thing or two about optimization. In this blog post, I’ll share some of the performance tips I’ve learned during my time at VictoriaMetrics.
A guide to PostgreSQL documentation and useful resources | PostgreSQL 101
Why PostgreSQL in 2023 | PostgreSQL 101
The Journey Towards PostgreSQL - Tips and Lessons | PostgreSQL 101
10 PostgreSQL extensions you need to know about | PostgreSQL 101
The Present and Future of Data Management Roles
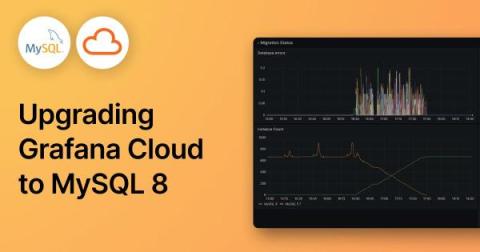
How we upgraded to MySQL 8 in Grafana Cloud
Starting around June this year, we upgraded our Grafana databases in Grafana Cloud from MySQL 5.7 to MySQL 8, due to MySQL 5.7 reaching end-of-life in October. This project involved tens of thousands of customer databases across dozens of MySQL database servers, multiple cloud providers, and many Kubernetes clusters.
Monitoring Redis Performance Metrics
Redis, as an in-memory data store, excels at providing high-speed data access and manipulation. However, without effective monitoring, the potential advantages of Redis can be compromised due to performance bottlenecks, scalability issues, and resource constraints. By closely scrutinizing key metrics, Redis monitoring allows you to proactively detect and address potential problems, ensuring the stability, reliability, and high-performance operation of your Redis environment.
Momentum: Announcing 268 Million Downloads & 320% Growth in 2023
We’re happy to announce a landmark 320% growth in 2023! VictoriaMetrics, our open source time series database and monitoring solution, already hit 268 million downloads this year (still counting), and received close to 13,000 stars on GitHub.
Grafana Tempo 2.3 release: faster trace queries, TraceQL upgrades
Grafana Tempo 2.3 has been unleashed upon the world, bringing with it the latest iteration of the vParquet backend! Tempo 2.3 has a little bit of everything, but the headline item here is vParquet3 and new features that improve search speeds. Watch the video above for all the details, or continue reading to get a quick overview of the latest updates in Tempo. If you’re looking for something more in-depth, don’t hesitate to jump into the changelog or our Grafana Tempo 2.3 release notes.


