Operations | Monitoring | ITSM | DevOps | Cloud
October 2022
"What were the hot topics of discussion at KubeCon?" - Civo TV
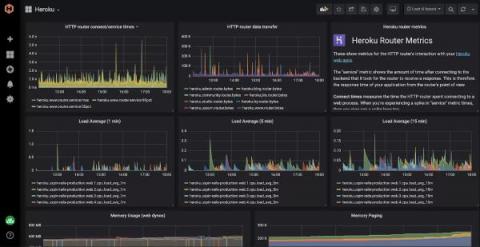
Installing the Hosted Graphite Heroku Monitoring & Dashboards Add-on.
HostedGraphite provides a complete infrastructure and application monitoring platform from a suite of open-source monitoring tools. Use Hosted Graphite and view all required metrics on beautiful dashboards in real time. Hosted Graphite offers a wide range of tools, add-ons, and plugins which make it possible to measure, analyze, and visualize large amounts of data about your applications with ease.
Ghouls and Goblins Beware: You Do Not Stand a Chance Against AIOps
It is getting spooky out there, folks! Every year on October 31, we don our spookiest (or silliest) garb, an evolution of old practices where people would dress up to ward off ghouls, goblins and all manner of things that go bump in the night. After all, people believed these pesky spirits stirred up trouble. While pieces of this spooky tradition persist, just a few other things have changed in the past 2,000 years. For starters, we are a digital society.
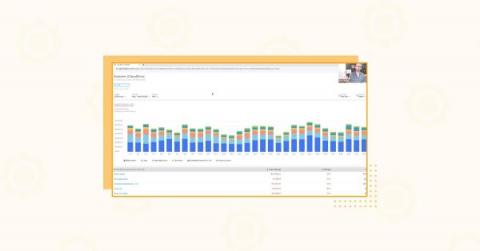
How To Ensure Healthy SaaS Metrics As Your Cloud Costs Grow
Why 'owning Services' is critical for effective Incident Response
On Building a Platform Team
It may surprise you to hear, but Honeycomb doesn’t currently have a platform team. We have a platform org, and my title is Director of Platform Engineering. We have engineers doing platform work. And, we even have an SRE team and a core services team. But a platform team? Nope. I’ve been thinking about what it might mean to build a platform team up from scratch—a situation some of you may also be in—and it led me to asking crucial questions. What should such a team own?
Adding team members and assigning roles with GitLab projects
Confidential computing in public clouds: isolation and remote attestation explained
In the first part of this blog series, we discussed the run-time (in)security challenge, which can leave your code and data vulnerable to attacks by both the privileged system software of the public cloud infrastructure, as well as its administrators. We also introduced the concept of trusted execution environments and confidential computing, (CC), as a paradigm to address this challenge.
The Power of IT Automation Empowers You | Puppet Enterprise
incident.fm, post-incident processes, and Crocs
As usual, it’s been all systems go at incident.io this month. New joiners, new features and new swag (yes, you heard right!). But most excitingly, we launched our new podcast this week. We had a blast recording it - we hope you enjoy listening to it just as much. Here’s a round-up of some of this month's highlights…
"How was your KubeCon experience?" - Civo TV
Eco - Product Demo
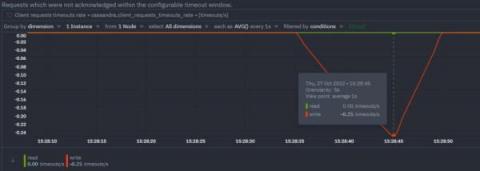
Monitoring & troubleshooting Cassandra with Netdata
Netdata’s Cassandra collector documentation explains how to set it up to collect metrics automatically. Once you have followed the instructions in the docs and have installed and configured Netdata on the Cassandra cluster you are ready to start monitoring and troubleshooting.
PagerDuty Experiences Significant EMEA Growth
Accelerate IT/OT convergence in Industry 4.0 [Part II]
Welcome to Part II of this three-part mini-series on bridging the gap between operational technology (OT) and information technology (IT) in Industry 4.0. In Part I, we set the stage for the remainder of the series and gave an overview of IT and OT, the two technological layers of modern industrial factories. In this blog, we expand on that knowledge by confronting the two domains and discussing the automation pyramid concept.
How To Unlock Granular Kubernetes Cost Metrics
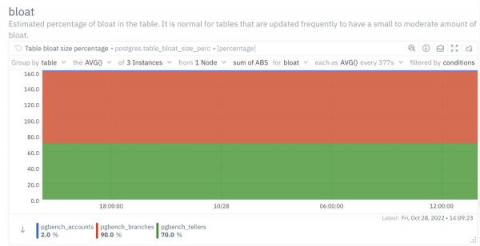
How to monitor and fix Database bloats in PostgreSQL?
Database bloat is disk space that was used by a table or index and is available for reuse by the database but has not been reclaimed. Bloat is created when deleting or updating tables and indexes. Here's how to deal with it!
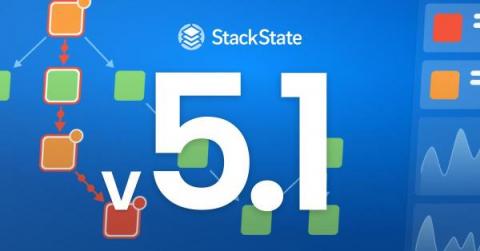
StackState Observability Platform v5.1 - Context Is King
Context is king, in particular if you are troubleshooting your stack. Having all the right information from your observability platform to understand the behavior of your stack is fundamental for solving problems. With our StackState Observability Platform v5.1 release, StackState takes a big step forward to provide you even more information that is crucial for making decisions and for finding the root cause of an issue faster.
Getting started with Azure API management health check
Preventing PII in Test environments
Top 10 cAdvisor Metrics for Prometheus
cAdvisor (container advisor) is an open-source container-monitoring platform developed and maintained by Google. It runs as a background daemon process for collecting, processing, and aggregating data into performance characteristics, resource usage statistics, and related information about running containers. With built-in support for Docker and literally any other container type out of the box, cAdvisor can be used to collect data on virtually any type of running container.
Network automation tools and their importance in today's networks
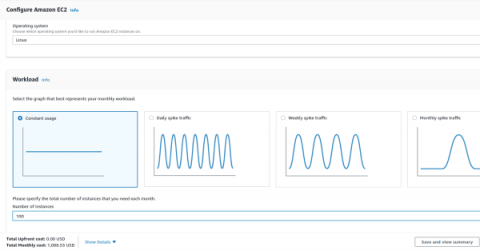
Understanding AWS pricing
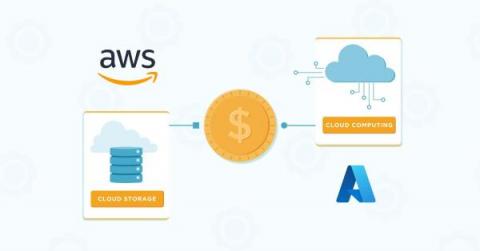
You launch a startup or a new project in your organisation. You decide to use Amazon Web Services (AWS) as your primary cloud platform. You estimate costs based on listed prices, and rest assured that your startup/project will meet its budget. And then, suddenly, at the end of the month, you receive an invoice from AWS for an amount two times higher than you originally expected.
Elektrobit partners with Canonical to pave the way to a new era of software-defined vehicles
ERLANGEN, Germany, October 27, 2022 – Elektrobit and Canonical today announced a partnership to bring the benefits of Canonical’s Ubuntu operating system to automotive software. As the industry transitions towards software-defined vehicles, the new partnership will make it easier than ever before for car makers, suppliers, and developers to create the next generation of vehicle applications, while meeting stringent automotive standards.
Routing alerts from AWS Elastic Beanstalk via CloudWatch
Goats on the Road: DevOp Struggles
The best part of my job is talking to you, our prospects, and customers, about your logging and data practices. I love listening to what you are doing and hope to accomplish, so I can get a sense of the end state. My goal is to brainstorm solutions that provide overall value across the enterprise, and not just aim for a narrow tactical win with limited impact. In late September, I hung out at a local DevOps conference in Brooklyn with the NYC Cribl sales team.
FutureNet Asia Fireside Chat: The Journey to Cloud-Native
Resolve + Microsoft Azure Auto-Remediation Demo
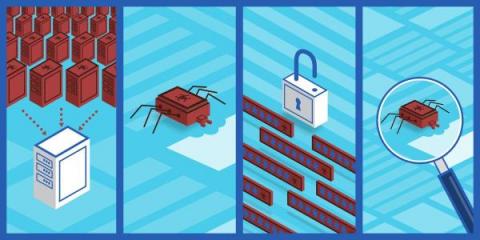
How to Find the Ghost Servers Haunting Your Data Center
It's almost Halloween, and we have a spooky and scary story for you. Don’t jump out of your seat, but did you know that most data centers are haunted and overrun by the undead? That’s right. Ghost servers (also known as zombie servers) are everywhere. In fact, up to 30% of servers in any data center may be ghost servers. Ghost servers are servers that are deployed in cabinets and powered on but are sitting idle without performing any useful function.
Preventing A $70K Cost Spike In 4 Clicks - And Protecting Our Profit (Video)
Kubewarden 1.3 is Here
The Kubewarden development team is happy to announce the release of the Kubewarden 1.3 stack. In addition to the usual amount of small fixes, this release focused on the following themes. If you’re not familiar with Kubewarden, it is a policy engine for Kubernetes. Its mission is to simplify the adoption of policy-as-code.
Cassandra monitoring
What are the important Cassandra metrics to monitor and how to monitor them.
Elastigroup now supports multiple AMI architectures in a single group
Redgate upgrades SQL Monitor query tuning capability to help development teams move faster and smarter
Showcase dashboards securely and effortlessly with Skykit's offering in the Datadog Marketplace
For many organizations, making the most of the visibility Datadog offers into the health and performance of their infrastructure means displaying dashboards to stakeholders in various settings continuously and in real time. But the standard solutions for sharing dashboards to large-format displays can be onerous, involving sundry software and hardware and restrictive manual setups. These solutions can also pose significant security risks, since they tend to involve sharing passwords or devices.
25 Kubernetes Monitoring Tools And Best Practices In 2022
Advanced Kubernetes interview questions
In the second part of our “Kubernetes interview questions” series, we have outlined ten questions to help those that want to take their Kubernetes knowledge to the next level. Read on to learn more about the difference between Kubernetes and Docker Swarm. We’ll also be covering how an organization can keep costs low using Kubernetes. If you missed part one, check it out here.
Top 3 SQL Recovery & Repair Tools
Data collected by you is a valuable asset, however, mere collection or accumulation of data may not be enough to result in a positive and noticeable change within your firm. According to Forbes, besides collecting data it is critical to make intelligent and appropriate use of data. Data is not supposed to be a visible asset. As such data collection may not be up to the mark, particularly while manually handling the process.
Tour Terraform Registries in Artifactory
VMware alternatives: discover open source
Think open source – the world’s leading software portfolio. Open-source software enables you to build fully functional virtualisation and cloud infrastructure while ensuring total cost of ownership (TCO) reduction and business continuity. In this blog, we will walk you through the open source ecosystem. We will help you understand how it differs from other VMware alternatives by answering five common questions.
Kubeflow just applied to join CNCF - what does it mean for you?
Google just announced that they have submitted an application for Kubeflow to become an incubating project in the Cloud Native Computing Foundation (CNCF). It is an initiative supported by the Kubeflow Project Steering group. The request is visible to everyone and it represents a game changer for the rhythm which Kubeflow will develop. It makes community growth a strategic objective and puts Kubeflow on a development fast track.
Managing the hidden costs of cloud networking - Part 2
In the first post of this series, I detailed ways companies considering cloud adoption can achieve quick wins in performance and cost savings. While these benefits of the cloud certainly remain true in theory, realizing these benefits in practice can be increasingly difficult as applications and their networks become more complex.
What's New and Coming to Spot PC (September 2022)
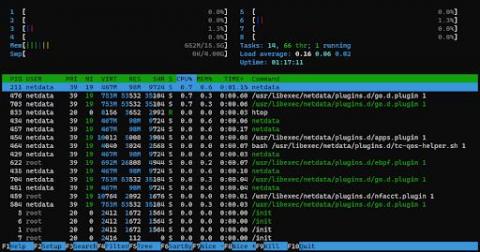
How to monitor server load
How to find out which application is causing server load
We often hear the term load used to describe the state of a server or a device, but we're here to tell you what it means, precisely, and how to monitor it.
Monitoring your Network SNMP devices using Hosted Graphite
When you design architecture to monitor your digital assets - either software applications or hardware devices, you need to use different strategies depending on your monitoring target. The factors you want to consider can vary including methods of retrieving monitoring data, frequency of data collection, and how you want to surface metrics and insight you find to stakeholders. In this article, we will mainly discuss how we can monitor your network SNMP devices using Hosted Graphite.
Run self-hosted CI jobs in Kubernetes with container runner
Container runner, a new container-friendly self-hosted runner, is now available for all CircleCI users. Self-hosted runners are a popular solution for customers with unique compute or security requirements. Container runner reduces the barrier to entry for using self-hosted runners within a containerized environment and makes it easier for central DevOps teams to manage running containerized CI/CD jobs behind a firewall at scale.
Incident Tracking - How it Works & Why It Matters | Blameless
Harvester 1.1.0: The Latest Hyperconverged Infrastructure Solution
The Harvester team is pleased to announce the next release of our open source hyperconverged infrastructure product. For those unfamiliar with how Harvester works, I invite you to check out this blog from our 1.0 launch that explains it further. This next version of Harvester adds several new and important features to help our users get more value out of Harvester. It reflects the efforts of many people, both at SUSE and in the open source community, who have contributed to the product thus far.
A dynamic workforce needs a flexible solution
The Roblox Outage
Success in the Cloud: How to Avoid Kubernetes Deployment Pitfalls
For organizations looking to succeed in their modernization efforts, our upcoming webinar will offer insights that could help you avoid the missteps that have caused other Kubernetes efforts to fail. Although Kubernetes has become the de facto standard platform for cloud-native digital innovation, it is a complex technology that requires sophisticated expertise to implement correctly, and that expertise is in short supply.
Developer Environment Story
Open Policy Agent (OPA) Overview Session
Location, location, colocation
You might think that colocation has been replaced by the cloud. But that’s only true in marketing terms. The reality is that colocation and the role it plays in modern edge computing has never been more important or more required. Believe it or not, cloud computing doesn’t happen in the actual sky – it happens in a data centre. And knowing where that data centre is, and how fast it links to your network and the internet, can be challenging with hyperscalers.
Don't get lost in public cloud promises
When it comes to cloud computing and the migration of services to the public cloud, we’ve been hearing the hype for years. “Just migrate to the cloud and everything will just work. Things will be bigger, faster, cheaper, and better.” The reality is that a migration to the cloud can result in serious disappointment from unrealistic expectations.
Ribbon's State of the art SBCs are certified for Google Voice SIP Link for Global Availability
Introduction to Automation Testing Strategies For Microservices
Microservices are distributed applications deployed in different environments and could be developed in different programming languages having different databases with too many internal and external communications. A microservice architecture is dependent on multiple interdependent applications for its end-to-end functionalities. This complex microservices architecture requires a systematic testing strategy to ensure end-to-end (E2E) testing for any given use case. In this blog, we will discuss some of the most adopted automation testing strategies for microservices and to do that we will use the testing triangle approach.
Broadcom's Rally Software Receives FedRAMP Authorization For Value Stream Management Solution
Accelerate IT/OT convergence in Industry 4.0 [Part I]
Welcome to this three-part mini-series on bridging the gap between operational technology (OT) and information technology (IT) in Industry 4.0. Throughout this series, we will discuss the key challenges industrial manufacturers face when trying to accelerate their digital transformation. We will understand why legacy update approaches and lack of security in OT do not suit the Industry 4.0 world and assess how adopting open source software can help bridge the gap.
SUSE Edge 2.0: A Cloud Native Solution to Manage Edge
We are proud to introduce SUSE Edge 2.0, which will empower customers to accelerate and scale edge infrastructures and transform edge operations.
From checklist to playbook: Creating structure for your processes
Playbooks aim to be a super-powered checklist for repetitive tasks. Before you can get to the “super-powered checklist,” though, you need to identify the process that you’ll use to build your first playbook and create a structured process as a Playbook checklist. Let’s go on that journey today.
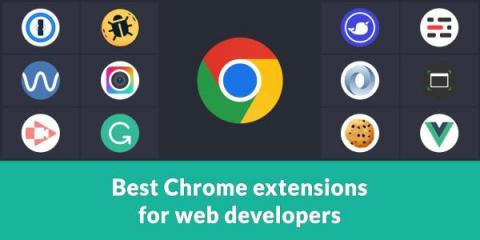
Best Chrome extensions for web developers
Chrome revolutionized the way to extend browsers with new features. Back in the day, extensions were annoying toolbars (remember the Ask toolbar?) and related spam-like additions. Today, I couldn't live without extensions. Here's a list of our favorite extensions used while developing elmah.io. Let's jump right into the extensions. All extensions are sorted alphabetically so make sure to go through the entire list for the best extensions for Chrome (and mostly Edge too).
5 Developer Horror Stories by the Qovery Team
Enterprise Package Management for Everyone
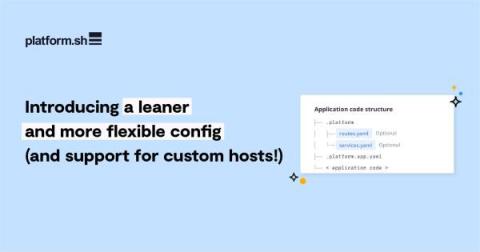
Introducing a leaner and more flexible config (and support for custom hosts!)
To make the developer experience as smooth as possible, we are simplifying the onboarding process. Howso? By making the Platform.sh configuration files optional (zero configuration!). Due to popular demands, we’re also giving you a simple way to control custom DNS entries directly in the YAML configuration files (see below). Previously, if you started from one of our many ready-to-use templates, those YAML files were automatically included.
Introducing the New Snyk App for Bitbucket Cloud
Turo's approach to reliability with real-world objects ft. Avinash Gangadharan
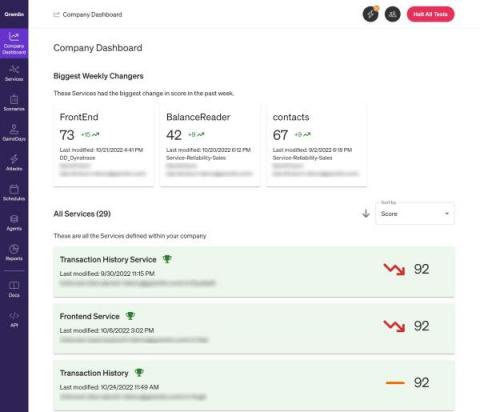
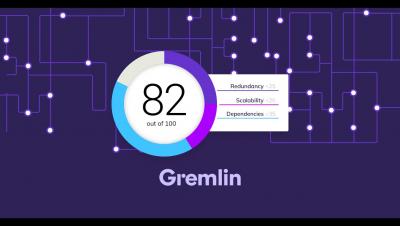
Managing and improving reliability using Gremlin's Reliability Dashboard
Part of a successful reliability program is being able to monitor and review your progress toward improving reliability. Being able to run tests on services is a big part of it, but how can you tell you're making progress if you can only see your latest test results? There should be a way to track improvements or regressions in your reliability testing practice across your organization in a way that's easy to digest. That's where the Reliability Dashboard comes in.
ITIM and Business Objectives
Every organization has business objectives (BO). These objectives can focus on numerous areas across the company and be related to almost anything within the organization: Identifying core objectives is important for the ongoing success of organizations. Objectives help keep organizations focused on what is deemed important for the future, which, of course, differs for each organization.
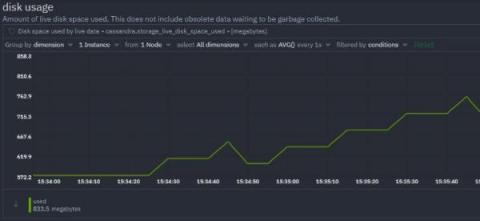
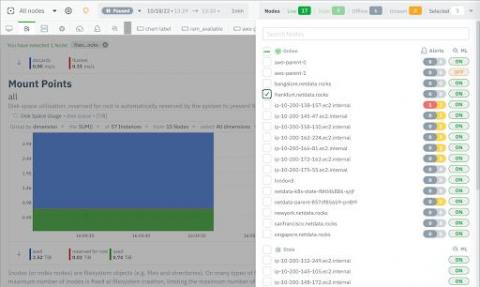
How to monitor the disk usage on your infrastructure
The most important part of disk usage monitoring is to check the utilization of each filesystem and each mount point which can reveal existing or impending issues with the storage space on your infrastructure.
Point Solution Monitoring vs. Domain-Agnostic AIOps. Which is Right for You?
Just consider how much of your day relies on online digital technologies. Perhaps you hopped on an app to pre-order your morning coffee and then logged onto a platform to book a car to work. Or, perhaps you stayed home to work, using digital tools to connect with your colleagues and exchange information.
Megaport ONE Infopaper
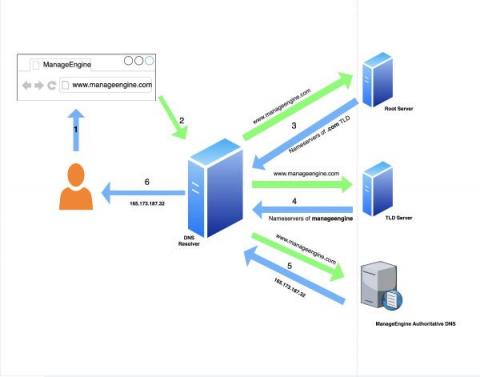
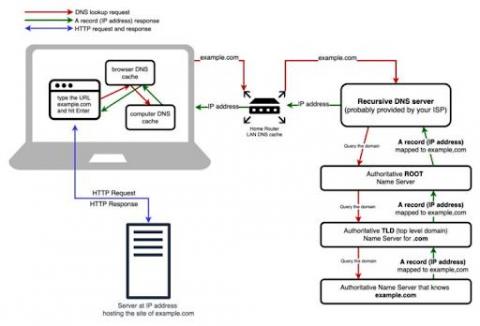
How does a DNS work?
DNS resolution is the first step taken to form an internet connection. This includes when any device is being used to access a website or any type of internet-enabled application, such as e-commerce, CRM, or food delivery. These applications are connected to the internet via IP-backbone, which is typically controlled by a protocol named BGP (Border Gateway Protocol). Each application has a unique numbering schema on the internet, referred to as IP address.
Puppet by Perforce Announces Continuous Compliance for DISA STIGs
Resolve Systems' IT Automation SaaS Solution Available on Microsoft Azure Marketplace
Best practices for network perimeter security in cloud-native environments
Cloud-native infrastructure has become the standard for deploying applications that are performant and readily available to a globally distributed user base. While this has enabled organizations to quickly adapt to the demands of modern app users, the rapid nature of this migration has also made cloud resources a primary target for security threats.
Scanning Secrets in Environment Variables with Kubewarden
We are thrilled to announce you can now scan your environment variables for secrets with the new env-variable-secrets-scanner-policy in Kubewarden! This policy rejects a Pod or workload resources such as Deployments, ReplicaSets, DaemonSets , ReplicationControllers, Jobs, CronJobs etc. if a secret is found in the environment variable within a container, init container or ephemeral container. Secrets that are leaked in plain text or base64 encoded variables are detected.
7 ways teams are using incident.io's Decision Flows
One of my favourite features in incident.io is Decision Flows. With it, you can create a series of questions which eventually lead to a decision based on what you’ve answered. You can pull up this flow during an incident and it’ll guide you through the questions. It’s like having an experienced on-caller calmly guide you through what to do when a crisis hits. This is complementary to incident.io’s Workflows feature.
Komodor Introduces New Companion Tool For Helm
Today, I am happy to see the public release of Helm-Dashboard, Komodor’s second open-source project, after ValidKube, and my first since joining the team as Head of Open Source. It’s a compelling challenge to try and solve the pain points of Helm users, but more than anything it’s a labor of love. So it is with love that we’re now sharing this project with the community, and I’m excited to imagine where it will go from here.
Getting started with Civo Academy
Here at Civo, we have created over 50 free video guides and tutorials to help you navigate Kubernetes: from understanding the basic need for and function of containers, to launching and scaling your first clusters. You can start learning everything you need to know to get started with Kubernetes today with our nine modules which were created by in-house experts at Civo!
Puppet supports DoD continuous compliance and configuration management
Puppet Enterprise now offers Compliance Enforcement Modules aligned to DISA STIGs Benchmarks. The Defense Information Systems Agency (DISA) Security Technical Implementation Guides (STIGs) were built to safeguard our most critical security systems and data against a dynamic threat environment, yet monitoring and enforcing widely deployed infrastructure at the U.S. Department of Defense (DoD) scale is a formidable task.
How To Build A Case For Your Cloud Cost Optimization Opportunity
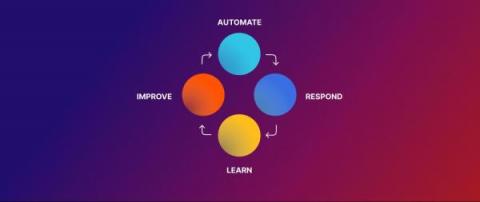
FireHydrant is now more powerful across the entire incident lifecycle
FireHydrant has partnered with incredible companies to transform incident response inside their organizations, but our goal has always been to support the full incident lifecycle. That’s because we know that investing in good incident management can kickstart your reliability efforts when it includes both a streamlined incident response process that helps you recover faster and the ability to learn from incidents and then feed those insights back into your system.
Introduction to Gremlin Reliability Management
Celebrating Over 13,000 Students And Thousands Achieving GitOps Certification with Argo
Earlier this year, when Codefresh announced the first course in our GitOps for Argo certification program – GitOps Fundamentals – we had high hopes that the course would satisfy the community’s pent-up demand for practical GitOps knowledge. To meet this demand, we designed a course that features lab environments to dramatically improve the learning experience. Each student gets a lab environment pre-configured with everything they need to learn GitOps using Argo CD.
3 Ways You Might Have an NOC Process Hangover
NOC, or network operation center, processes have been set in stone for decades. But it’s time for some of these processes to evolve. Digital transformation and the cloud era have led to the rise of DevOps, and with it, service ownership. Service ownership means that developers take responsibility for supporting the software they deliver at every stage of the life cycle. This brings development teams closer to their customers, the business, and the value they deliver.
We're listening! Leveling up how we gather, review, and respond to product feedback.
Using External Dependencies with Conan @ Bay Area C++ User Group Meetup
What Is the Controllability and Observability of Cloud Applications?
There are many computing resources used in different cloud application services to provide online software-as-a-service (SaaS). SaaS differs from traditional applications in that it works from a cloud computing environment. This means that both the application service as well as user data are being hosted by a cloud provider in the cloud. Therefore, the SaaS and data are accessible from anywhere as long as there's online access. This model provides a distinct advantage from a software perspective.
OpenTelemetry Java - Your Guide to Getting Started
OpenTelemetry (OTel), an open source project under the Cloud Native Computing Foundation (CNCF), is a collection of tools, APIs and SDKs for generating and collecting observability data (mainly trace, metrics and logs) from cloud-native applications. An industry-standard for distributed tracing and observability, OTel enables analyzing application health and performance to ensure production-readiness and support production monitoring.
Terraform Cost With ServiceNow
The Entire Software Development Process, Open-Source and Automated via Backstage
The #1 KPI is not how fast a developer codes, but rather how long it takes from the time a developer starts to work on a new feature till it gets to production. In this blog I’d like to describe a few concepts and present a real life example, where we utilized a chain of open source tools to automate the entire software development process, from code to production.
10 Reasons You Need Data Center Cable Management Software
Modern data centers are complex environments that often contain many thousands of individual cabling and port components. When the physical connectivity infrastructure is not properly organized, tracked, and managed, you can quickly run into serious problems.
SUSE Rancher and Komodor - Continuous Kubernetes Reliability
With 96% of organizations either using or evaluating Kubernetes and over 7 million developers using Kubernetes around the world, according to a recent CNCF report, it’s safe to say that Kubernetes is eating up the world and has become the de-facto orchestrating system of cloud-native applications. The benefits of adopting K8s are obvious in terms of efficiency, agility, and scalability.
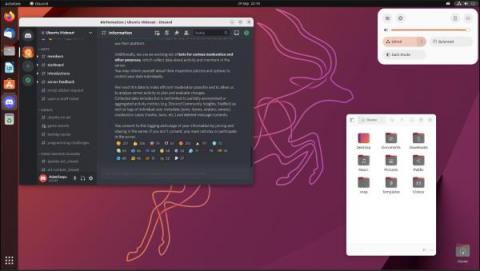
What's new in Ubuntu Desktop 22.10, Kinetic Kudu
Ubuntu Desktop 22.10, codenamed Kinetic Kudu, is here! This is the first release after Ubuntu 22.04 LTS, which means that there are a number of changes in both the underlying technology and the user experience, as well as some previews of what might be on the horizon in future releases. Excited? Let’s jump straight into our highlights.
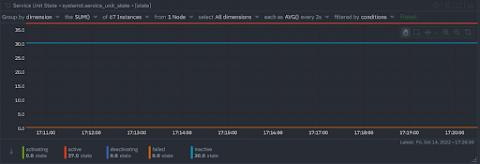
How to monitor systemd service liveness
The life of a sysadmin or SRE is often difficult, but occasionally very simple things can make a huge difference. Basic monitoring of your systemd services is one of those simple things, which we sometimes overlook. The simplest question one would want to know is if the thing that’s supposed to be running is actually running at all. If you use systemd services, you can guarantee an answer to that question within minutes using Netdata.
7 types of Redis latency and how to fix it
Redis is designed to be fast. In most cases, it is. However, there are times when Redis may be slow, due to network issues, disk latency, or other factors. When this happens, it is important to be able to detect the slow down and investigate the cause. Latency is the maximum delay between the time a client issues a command and the time the reply to the command is received by the client. Redis has strict requirements on average and worst case latency.
Google Cloud Managed Service for Prometheus
Using CI/CD to deploy web applications on Kubernetes with ArgoCD
GitOps modernizes software management and operations by allowing developers to declaratively manage infrastructure and code using a single source of truth, usually a Git repository. Many development teams and organizations have adopted GitOps procedures to improve the creation and delivery of software applications. For a GitOps initiative to work, an orchestration system like Kubernetes is crucial.
How DevOps Monitoring Works: Concepts, Types & Best Practices
DevOps is an IT delivery concept that combines people, practices and tools with the shared goal of accelerating the development of applications and services. Adopting DevOps at enterprise level typically requires: The continuous development of DevOps practices, as well as other factors like the rapid pace of modern code changes, facilitates a need for DevOps monitoring: a set of tools and processes to support the entire software development lifecycle.
Tracking IDocs for Integration Scenarios with Serverless360 BAM
LIVE NOW: How Do Mature DevOps Teams Manage Software Security?
Canonical releases Ubuntu 22.10 Kinetic Kudu
Codenamed “Kinetic Kudu”, this interim release improves the experience of enterprise developers and IT administrators. It also includes the latest toolchains and applications with a particular focus on the IoT ecosystem.
How to Orchestrate your Django application with Kubernetes
Do you have an application built with Django and PostgreSQL that you’d like to run on Kubernetes? If so, you’re in luck! In this tutorial, you’ll learn how to orchestrate your Django application with Kubernetes. Since we’re working with multiple microservices, it can be difficult to ensure all parts work together. This tutorial will demystify all that.
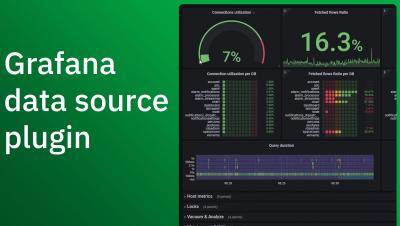
Introducing the new data source plugin for Grafana
Webinar: How Do Mature DevOps Teams Manage Software Security?
What is Reliability Management?
Measuring and improving the reliability of technical systems has always been challenging. As an industry, we've developed several practices to try and address reliability concerns, such as incident response, observability, and Chaos Engineering. This led SREs and service owners to measure reliability in a handful of ways.
This is Komodor
Gain Competitive Advantage Through Cloud Native Technology
Organizations around the globe recognize the importance of digital transformation to respond to the demands of the modern world. Organizations can advance their business by adapting technology, processes and tools. By doing so, they can increase flexibility, efficiency, security and improve customer experiences to boost success and gain competitive advantage. However, digital transformation is not always easy.
What is container orchestration?
Containerization is a type of virtualization in which a software application or service is packaged with all the components necessary for it to run in any computing environment. Containers work hand in hand with modern cloud native development practices by making applications more portable, efficient, and scalable.
A step-by-step guide to successfully migrating to the cloud
How automation drives DevOps
DevOps is the combination of software development and IT operations. It is a set of tools and methodologies designed to speed up the development of a product and facilitate efficiency throughout its lifecycle. DevOps can increase the rate at which applications and updates are delivered by managing and automating the monotonous and repetitive tasks that plague the development and deployment process.
A Guide to SD-WAN
SD-WAN has been making waves in the networking world thanks to its ability to provide dependable edge-to-cloud connectivity. Here’s how it works, and how it could help you.
How to Reduce Costs With DevOps
As defined by Amazon Web Services, DevOps is the integration of cultural concepts, practices, methods, and tools which allow an organization to provide services and applications at high speed: advancing and improving their products at a much faster rate than those using traditional software process for infrastructure management and development. This allows organizations to serve clients more effectively and compete in the market.
Use Datadog Continuous Testing to release with confidence
Testing early and often in the development cycle is a must for ensuring that your application meets user expectations. Poor performance and errors can alienate users and prevent you from meeting crucial benchmarks and OKRs. Additionally, having to constantly implement fixes after new, under-tested features are added can fatigue developers and strain your resources, making your organization less nimble overall.
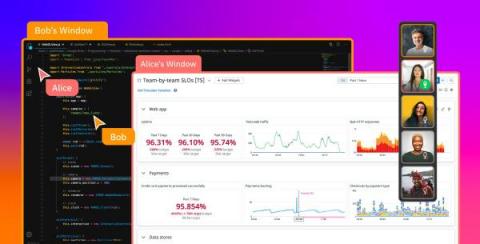
Leverage collaborative screen sharing with Datadog CoScreen
Remote collaboration tools have transformed how remote and hybrid teams work synchronously. But while the current popular chat forum and video conferencing solutions are inarguably helpful, few were created with software development and operations in mind. CoScreen is the only real-time collaboration tool designed specifically for remote and hybrid engineering teams that integrate both interactive screen sharing and video conferencing features.
Identify and redact sensitive data in APM, RUM, and Events stream with Sensitive Data Scanner
Customer-facing applications request and process many types of sensitive data, such as API keys, credit card numbers, and email addresses. As your application scales in size and complexity, it becomes harder to keep track of this sensitive data moving across more services, increasing the risk of data leaks.
Announcing PCI-Compliant Log Management and APM from Datadog
For any organization that stores, processes, or transmits cardholder data, monitoring can pose a particular set of challenges. The Payment Card Industry (PCI) Data Security Standard (DSS) dictates rigorous monitoring and data security requirements for the cardholder data environments (CDEs) of all merchants, service providers, and financial institutions.
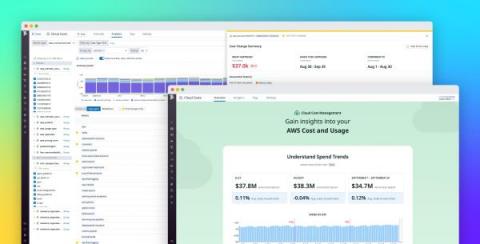
Gain visibility and control of your cloud spend with Datadog Cloud Cost Management
To optimize its cloud investments, your organization needs internal stakeholders to act on shared knowledge about its cloud costs and cloud usage. But in practice, it’s difficult for organizations to gain a high degree of clarity about their cloud spending. The factors contributing to cost data are not normally visible to all stakeholders, and it’s often impossible to attribute costs to the teams, services, and applications that incurred them.
Dash 2022: Guide to Datadog's newest announcements
Today at Dash 2022, we announced new products and features that enable your teams to break down information silos, shift testing to the left, monitor cloud and application security, and more. Now, you can analyze cloud cost data alongside other telemetry, create synthetic tests for your mobile applications, and prevent malicious activity in your environment by blocking IPs directly from Datadog. We expanded Sensitive Data Scanner to include APM, RUM, and Events stream data.
AWS Vs. Azure Pricing: An Essential Guide For 2022
How you can use the Pandas Python collector to monitor weather data
Netdata just launched a Pandas collector. Pandas is a de-facto standard in reading and processing most types of structured data in Python so if you have some csv/json/xml data, either locally or via some HTTP endpoint, containing metrics you’d like to monitor, chances are you can now easily do this by leveraging the Pandas collector without having to develop your own custom collector as you might have in the past.
SolarWinds Observability - A Unified Full-Stack Solution for DevOps Teams
Intel Optimization Hub
Cloud Service Providers (CSPs) offer an ever-expanding array of instance types, ensuring that for any given workload there exists the perfect hosting option that matches the exact needs of that app or business service. But with this expansion comes an ever-increasing challenge to match the workloads to the offerings – there are many things to consider.
Kubernetes Load Balancers Guide - Civo Academy
Five Reasons to Use Base Container Images
Nowadays, the software development paradigm is based on containerizing applications to deploy on pods to let Kubernetes manage it. Containerized applications can then allow Kubernetes to manage its deployment, replication, high availability, metrics and other capabilities so that the application can focus on doing what it was designed to do. This technology is used for projects and by customers all over the globe.
Building a Fleet of GKE Clusters with Argo CD with Nick Ebert, Google
Perfect Image Leverages Virtana's Cloud Cost Management Tool for 30% Cost Savings
What Is Infrastructure Monitoring & How Does It Work?
Three Years in the Making: Redgate Launches Enterprise Version of Popular Open Source Migrations Tool, Flyway
2bcloud Expands U.S. Operations
The Ultimate Guide to Containers and Why You Need Them
Containers have long been used in the transportation industry. Cranes pick up containers and shift them onto trucks and ships for transportation. Container technology is handled in a similar vein in the software world. A container is a new and efficient way of deploying applications. A container is a lightweight unit of software that includes application code and all its dependencies such as binary code, libraries, and configuration files for easy deployment across different computing environments.
Process Automation and Rundeck OSS Release Notes v4.7.0
NodePort and Headless Service for Kubernetes - Civo Academy
ANS increases visibility for customers with easy implementation
How to rein in cloud chaos with Puppet
Cloud automation can do a lot for your organization, making it possible to automate resource creation, management, and housekeeping tasks. If you’ve thought that cloud automation is out of reach, or you’re curious to learn what it can do, we’re excited to announce a brand new webinar that can help! Discover cloud automation in action and walk away with code that you can get up and running within an hour.
Carrier Partners with LogicMonitor in Path to Unified Observability
Overview | CircleCI's configurable iOS resources
How to monitor the impact of Puppet Runs using Hosted Graphite
In this article, we will look at what Puppet is and why it is important to monitor Puppet server metrics. We will also analyze the tools that help us monitor Puppet’s performance. Ultimately we will learn about the benefits of using Hosted Graphite by MetricFire to monitor Puppet server metrics. Sign up for MetricFire free trial today or book a demo with the MetricFire team to understand how you can take advantage of its monitoring solutions.
Your Infrastructure Monitoring Tool May Be Holding Back Productivity
Productivity is one of the measures economists use when looking at the health of and growth (or lack thereof) of economies. Productivity growth is the ability of people to do more with the same or only marginally more effort. So, when Henry Ford introduced his assembly line to automobile manufacturing, he dramatically increased employee productivity. In the case of Henry Ford, the benefits of massive increases in productivity included.
How Cortex can help you get the most out of Kubernetes
Bridging the Gap Between Applications and Kubernetes Environments
Organizations are eagerly adopting containers and Kubernetes, investing in cloud-native to foster innovation and growth. According to the CNCF and Slashdata, nearly 5.6 million developers use Kubernetes. That’s 31% of all backend developers. We all know that Kubernetes is a great container management platform.
Megaport Virtual Edge (MVE) Infopaper
Megaport Overview
Collect GitHub audit logs and scanning alerts with Datadog
For most organizations, GitHub is mission critical. Your GitHub repositories likely also contain some of your organization’s most sensitive data. GitHub provides tools to help you protect and govern this data, with tools such as audit logs, code scanning alerts, and secret scanning alerts. However, analyzing these logs and alerts through GitHub’s UI can be challenging. For example, looking for trends in your code scanning alerts over time through GitHub’s UI is just not possible.
How desktop and GPU virtualisation power up automotive innovation
Autonomous vehicles are all over the media these days. But what of the technologies that make them possible? In a previous blog post, we covered the many fascinating use cases for digital twins and their applications for the development of self-driving cars. But with the race towards autonomy becoming fiercer, the costs to use these new enabling technologies are rising exponentially. Moreover, the need for talent and experts across the world is forcing companies to shift to remote work.
4 Website Security Threats (2022) + Solutions
For server administrators tasked with ensuring the reliable operation of their web applications, the thought of a lurking cyberattack can be one to lose sleep over. An attack on your system and the services you provide could render your web applications unresponsive. What’s worse, important information that depends on privacy and the careful storing of data is put at risk.
9 tips for keeping down cloud expenditure
Learn about the Basics of ClusterIP - Civo Academy
12 Cloud Cost Optimization Examples For Your Cost Journey
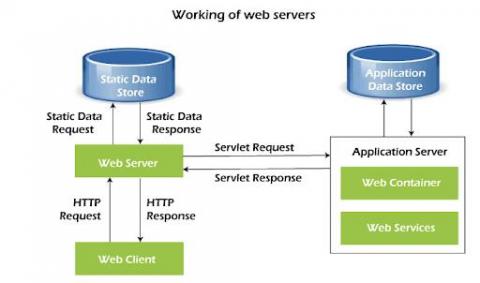
How to monitor web servers and their performance
Web servers are among the most important components in modern IT infrastructures. They host the websites, web services, and web applications that we use on a daily basis. Social networking, media streaming, software as a service (SaaS), and other activities wouldn’t be possible without the use of web servers. And with the advent of cloud computing and the movement of more services online, web servers and their monitoring are only becoming more important.
Sending large files to Puppet Support
Virtana #CloudHacks Series - Identify Cloud Costs with Tagging Capabilities
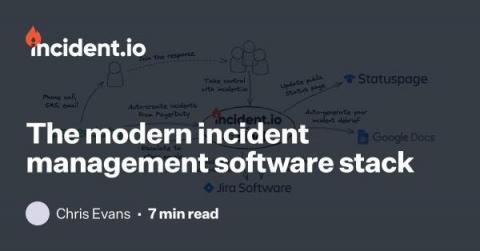
The modern incident management software stack
We’re fortunate enough to speak to a huge number of companies about their incident management processes. In doing so, we’ve noticed an emergent trend in how modern companies are using software to support their incident management processes, and a common set of challenges faced by them too.
Eco Reports Product Demo
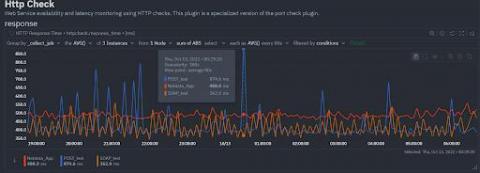
How to monitor HTTP endpoints
The HTTP protocol has become the de facto standard application layer protocol of the internet. From publicly available web sites and APIs to “inter-process” communications in REST based microservice architectures or large Service Oriented Architectures based on SOAP, you find HTTP being used again and again, due to its simplicity and our familiarity with it. How many protocols can you name that have memes for their status codes?
From DevOps to Platform Engineer: 6 Things You Should Consider
Startup and running configuration management
Configurations are considered the heart of network infrastructure. They are often adjusted to improve the overall workflow of the network environment. One small unnecessary change to a configuration can bring down an enterprise’s entire network infrastructure. Therefore, the changes made to configurations must always be checked to ensure they are in sync with the devices to improve efficiency and performance. A network configuration is generally divided into two parts: 1.
SaaS Companies Are Reporting Weaker Margins Than They Need To - Here's Why
How to Install and Upgrade Argo CD
We have already covered several aspects of Argo CD in this blog such as best practices, cluster topologies and even application ordering, but it is always good to get back to basics and talk about installation and more importantly about maintenance. Chances are that one of your first Argo CD installations happened with kubectl as explained in the getting started guide.
EKS Cost Optimization: 7 Best Practices To Apply Immediately
Mattermost v7.4 is now available
Mattermost v7.4 is generally available today. The following new features are included (see changelog for more details).
Updating A Forge Module In Puppet Enterprise Using Code Manager
Redis Monitoring Upgrade
Deploy a serverless workload on Kubernetes using Knative and ArgoCD
Containers and microservices have revolutionized the way applications are deployed on the cloud. Since its launch in 2014, Kubernetes has become a standard tool for container orchestration. It provides a set of primitives to run resilient, distributed applications. One of the key difficulties that developers face is being able to focus more on the details of the code than the infrastructure for it. The serverless approach to computing can be an effective way to solve this problem.
Logic App Best practices, Tips, and Tricks: #17 using other HTTP Methods then POST
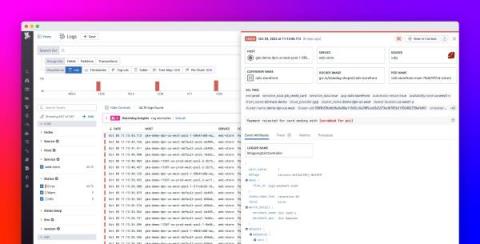
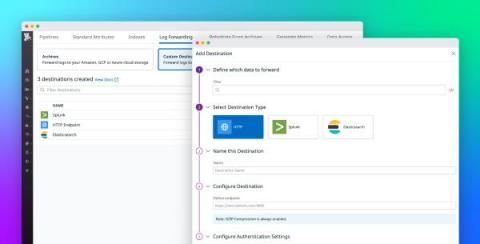
Route logs to third-party systems with Datadog Log Forwarding
Large organizations often rely on multiple monitoring tools, security platforms, and auditing systems to meet the diverse needs of their observability, security, engineering, and compliance teams. Because these teams may use the same logs for many different use cases—including detecting potential threats or breaches, troubleshooting errors, and gauging the effectiveness of new features—it can be difficult to effectively standardize and route data.
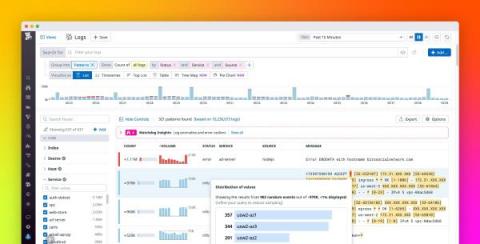
Discover the values behind log patterns with Pattern Inspector
Whether you’re rushing to troubleshoot an incident or proactively performing a security audit, the trial-and-error process of searching through millions of logs for key information can be time-consuming and cumbersome. To help you quickly surface important details from large swaths of log data, Datadog’s Log Explorer allows you to search and filter your logs, create visualizations, as well as group your logs by fields, patterns, or transactions.
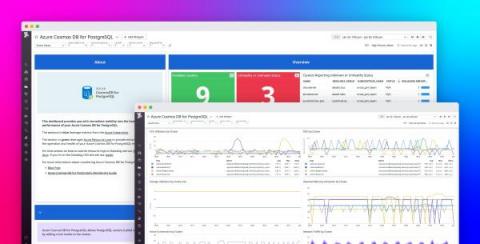
Monitor Azure Cosmos DB for PosgreSQL with Datadog
Azure Cosmos DB for PostgreSQL is a fully managed relational database service for PostgreSQL that is powered by the open source Citus extension. With remote query execution and support for JSON-B, geospatial data, rich indexing, and high-performance scale-out, Cosmos DB for PostgreSQL enables users to build applications on single- or multi-node clusters.
Improve Application Reliability With 4T Monitors
StackState’s new 4T Monitors introduce the ability to monitor IT topology as it changes over time. Now your observability processes can trigger alerts on changes in topology that don’t match an ideal state, on deviations in metrics and events and on complex combinations of parameters. Monitoring topology as part of your observability efforts enriches the concept of environment health by adding the dimension of topology.
Canonical launches Ubuntu Pro Beta
How to Find Stranded Capacity in Your Data Center
Data center capacity planning is one of the biggest challenges for today’s data center professionals. According to a recent survey by Sunbird Software, 72% of respondents said that capacity planning was one of their top objectives. Proper capacity planning results in the right-sized data centers, efficient utilization of resources, and reduced costs, but it is easier said than done.
SaC - How to build status pages as code with Terraform
Status pages are a clever solution to bundle all your services, and see the status of them at one sight. We at iLert took this one step further: why not build your status page as code using Terraform? We want to show you how we make it possible, and how you can set it up for your own infrastructure - a real SaC solution.
What Metrics and KPIs Really Matter in Availability?
In our inaugural State of Availability Report, we discovered that not only do metrics matter but the way we use them also does. Our research found that teams with fewer KPIs were more likely to meet their Service Level Agreements (SLAs) and provide their customers with higher levels of availability. The problem with having too many KPIs is that they cause information overload and noise.
Authors' Cut-Gear up! Exploring the Broader Observability Ecosystem of Cloud-Native, DevOps, and SRE
You know that old adage about not seeing the forest for the trees? In our Authors’ Cut series, we’ve been looking at the trees that make up the observability forest—among them, CI/CD pipelines, Service Level Objectives, and the Core Analysis Loop. Today, I'd like to step back and take a look at how observability fits into the broader technical and cultural shifts in technology: cloud-native, DevOps, and SRE.
Beginners Guide to Kubernetes Services - Civo Academy
SRE Fundamentals: Everything you need to know
Send metrics and traces from OpenTelemetry Collector to Datadog via Datadog Exporter
OpenTelemetry is an open source, vendor-neutral observability framework that provides tools, APIs, and SDKs to collect and standardize telemetry data from cloud-native applications and services. One of OpenTelemetry’s key components is the OpenTelemetry Collector, which receives and processes data before using exporters to route it to the destinations of your choice.
Forward logs from the OpenTelemetry Collector with the Datadog Exporter
OpenTelemetry is an open source set of tools and standards that provide visibility into cloud-native applications. OpenTelemetry allows you to collect metrics, traces, and logs from applications written in many languages and export them to a backend of your choice.
Microservices or a monolith - which one are you?
One analogy of a microservice architecture that I personally like is the idea of a large office setting with disparate departments communicating through an internal mail system. I imagine manilla envelopes being passed around, carried on carts through hallways, up elevators—passing the information one department needs to the next department.
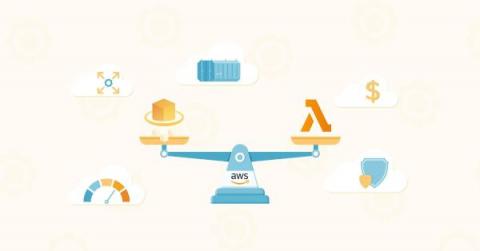
Fargate Vs. Lambda: The Last Comparison You'll Ever Need
Content creation best practices for DevRels by @Eddie Jaoude
Working Locally to Enhance Your Python Collector
If Jimi Hendrix Were Your CIO, You'd Be Rocking Smart Cloud Native
Jimi Hendrix was an innovator who pushed musical boundaries by employing leading-edge technologies as fast as they were invented. The new guitar effects he adopted in the late 1960’s included fuzz, Octavia, wah, and Uni-Vibe pedals. Jimi would gobble up these guitar pedals and incorporate them into his sound to create wildly creative sonic experiences.
Google Cloud Next '22 Opening Keynote
How to Simplify Your Graphite Metric Ingestion Pipeline with Histograms
Many organizations relying on Graphite will be leveraging telemetry provided through Statsd. And if you rely on Graphite in combination with StatsD telemetry, you’re likely suffering from aggregation bloat. In a typical Graphite ingestion pipeline, applications emit data points via UDP, which are then received by an aggregator such as StatsD. Most StatsD servers only offer static aggregations, which must be configured upfront.
Reliability vs. Availability: What's The Difference?
Viewing OpenTelemetry Metrics and Trace Data in Observability by Aria Operations for Applications
Modern application architectures are complex, typically consisting of hundreds of distributed microservices implemented in different languages and by different teams. As a developer, site-reliability engineer, or DevOps professional, you are responsible for the reliability and performance of these complex systems. With observability, you can ask questions about your system and get answers based on the telemetry data it produces.
How to monitor DNS query response time
DNS (Domain Name System) servers translate standard language web addresses to their actual IP addresses for network access. DNS response time is the time it takes a Domain Name Server to receive the request for a domain name’s IP address, process it, and return the IP address to the browser or application requesting it. When it comes to DNS response times, the lower the better, and generally values less than 100ms are considered to be in the acceptable range (depending on the application).
How to Fix Poor Google Cloud Latency
Learn how to reduce your latency and get better network performance from the popular cloud service provider.
Canonical works with NVIDIA and BT to unlock infrastructure scalability for data scientists, technical and creative professionals
Ubuntu KVM — an industry-leading hypervisor — extends its reach to AI/ML applications and graphics-intensive applications with native support for NVIDIA virtual GPU (vGPU) software products, including NVIDIA Virtual Compute Server (vCS) and NVIDIA RTX Virtual Workstation (vWS). Canonical has been working closely with NVIDIA to ensure frictionless integration and a best-in-class user experience.
How to change the Tiering of Azure Blobs
In this blog post, I will show you how easy it is to move a single Azure Blob or even select mutlipe or the complete container and move those blobs from any storage tiering to another with just a few clicks. There are cost benefits moving your Azure Blobs down to a lower Storage Tier, Hot being the most expensive, with a cool a little bit cheaper, and the Archive Blob Tier having the lowest cost option. For most Azure Storage Cost saving ideas, we cover some in another blog.
How AIOps enhances operational efficiency
Digital data is everywhere, and its sheer volume and ambiguity often make it challenging for us humans to analyze. That’s why we use a special branch of AI called artificial intelligence for IT operations (AIOps) to reveal the deeper structure of copious data. AIOps sits at the intersection of big data and machine learning to improve the efficiency of IT operations.
Monthly Moo | October 2022
Summer has passed and it’s time for fall - cue transitioning leaves, cozy blankets, and all the pumpkin-themed things your heart could ever desire. As we move into the new season, we are excited to announce our fall product releases across Moogsoft Cloud that enable engineers to detect incidents earlier, resolve them faster, and work as a team across the entire lifecycle. Moogsoft’s Fall product updates enable you to: … and so much more! Read on for deeper details.
Review changes before deploying to production - Build. Preview. Deploy.
Whether you have two or two dozen developers working on features for your product, updates can introduce bugs or unwanted changes. Therefore, before merging a feature branch to production, you can review all the changes with our preview deployment feature. It allows you and your team to quickly and easily check that the latest changes work as desired. It also allows you to share feedback and helps prevent “it worked on my machine” scenarios.
Hyperscaling the open-RAN ecosystem, exploring virtualized open-RAN and cloud-native deployment
New Vulnerability Scanning Features in Tanzu Application Platform 1.3
Get your time back by getting rid of unused modules with Dropsonde
You’ve probably been using Puppet Forge modules to manage bits in your infrastructure for years. If you’re like most of us, you’ve gradually added more modules and maybe you’ve lost track of exactly what some of them do and on what nodes they’re declared. You may even suspect that you have modules installed that you haven’t actually used in years…. only you’re not quite certain which modules those might be. I am certainly guilty of this!
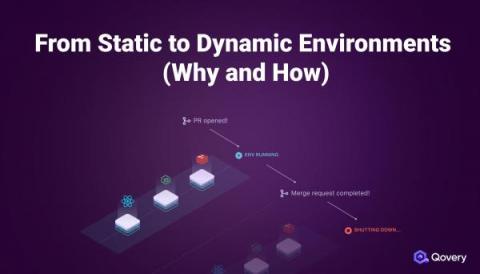
From Static to Dynamic Environments (Why and How)
What is confidential computing? A high-level explanation for CISOs
Privacy enhancing technologies and confidential computing are two of my favorite topics to talk about! So much so that I am writing this blog post on a sunny Saturday afternoon. But wait, what’s that I hear you murmuring? “What is confidential computing? And how does it affect me?” Those are two very good questions.
VMware Tanzu Application Platform 1.3 Improves Developer Productivity and Simplifies DevSecOps
At VMware Explore 2022, we pre-announced new capabilities in VMware Tanzu Application Platform 1.3. Today, we’re excited to announce general availability of these capabilities to further enhance developer and application operator experiences on any Kubernetes environment, increase supply chain security, and offer additional ecosystem integrations.
Containers vs virtual machines: what is the difference?
In computing, virtualization is the creation of a virtual — as opposed to a physical — version of computer hardware platforms, storage devices, and network resources. Virtualization creates virtual resources from physical resources, like hard drives, central processing units (CPUs), and graphic processing units (GPUs). By virtualizing resources, you can combine a network of resources into what appears to users as one object.
Setting better SLOs using Google's Golden Signals
To many engineers, the idea that you can accurately and comprehensively track your application's user experience using just a few simple metrics might sound far-fetched. Believe it or not, there are four metrics that aim to do just that. They're called the four Golden Signals and should be a core part of your observability and reliability practices.
Atlassian Automation overview | Atlassian
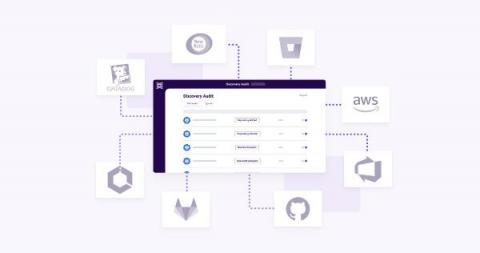
Building confidence with Cortex Discovery Audit
Production Data Simulation: Record in One Environment, Replay in Another
Have you ever experienced the problem where your code is broken in production, but everything runs correctly in your dev environment? This can be really challenging because you have limited information once something is in production, and you can't easily make changes and try different code. Speedscale production data simulation lets you securely capture the production application traffic, normalize the data, and replay it directly in your dev environment. There are a lot of challenges with trying to replicate the production environment in non-prod.
How we do realtime response with incident.io, Sentry & PagerDuty
Like most tech companies, we use an on-call rota and various alerting tools. We do this to respond to incidents before they’re reported. Proactively identifying issues and communicating to customers helps us provide great experiences and fosters trust. Internally, we’ve been using these alerting tools in tandem with our auto-create incidents feature. We’ve found that it’s made responding to the pager much smoother - it’s one less thing to do when you get paged at 2am.
IoT Project Lifecycle: Key considerations for OTA updates at scale [Part IV]
From entertainment to security, automation is now pervasive. Intelligent devices are transforming our homes while enriching our lives, making them more efficient, productive and environmentally friendly. Most embedded devices run Linux, and their number is poised to keep growing.
Rising IT costs: What to watch out for
Demystifying the complexity of cloud-native 5G network functions deployment using Robin CNP - Part II
Now that we have discussed the networking part , the next step is placing the application into a host. Robin.io’s cloud platform has the concept of master, compute, and storage nodes. Typically, the hardware servers would have multiple NUMA nodes. In order to achieve the best performance, the platform should utilize the resources from the same NUMA node. Failing this – if users are consuming a resource from another NUMA node – then their performance would degrade.
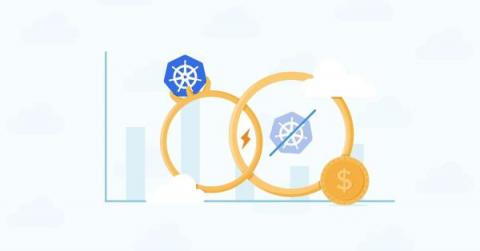
The Power Of Combining Kubernetes And Non-Kubernetes Cloud Spend
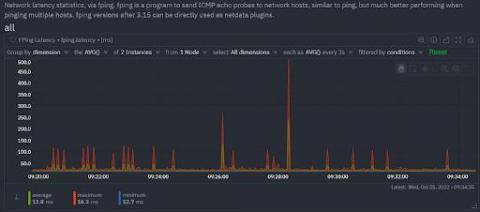
How to monitor host reachability
Most sysadmins and developers have at some point used a few of the popular Linux networking commands or their Windows equivalents to answer the common questions of host reachability- that is, whether a host or service is reachable and how fast it responds. One of the simplest, common checks, is to simply ping a host to verify that it’s reachable from where you issue the command, and to see the total time it takes for the host to receive your request.
New State of DevOps Report 2022: Broadcom Sponsors Key Research
For DevOps teams looking for insights on how to improve, it’s invaluable to leverage the learnings of others. At the same time, given the wide range of DevOps teams’ expertise, tenure, and organizational dynamics, it’s also clear that one size does not fit all. That’s why efforts like this year’s “Accelerate State of DevOps Report” are so important. We’re proud to be a sponsor of this 2022 edition.
Don't sweat the network costs, Ocean provides application cost visibility to your Kubernetes cluster
Why is data replication important?
High availability. This is what every monitoring tool needs to ensure that you never compromise on IT infrastructure visibility. On top of high availability, do you really want to enable all available features on your production system? It is important for the monitoring tool to have a low footprint on your CPU consumption and memory usage. Let’s dive deeper into the recommended way of configuring Netdata to ensure high availability and a low resource footprint through data replication.
A Beginners Guide to Container Network Interfaces (CNI) - Civo Academy
The Blameless Complete Guide to Incident Management
How Many SREs Does Your Company Need? Here's How to Decide
So you’ve decided to take advantage of Site Reliability Engineering by hiring SREs for your company. Now, you have a second decision to make: Exactly how many SREs to hire. Do you need just one or two SREs? Or should you build a sprawling SRE team, with a dozen or more SREs on hand to support your organization’s reliability needs? The answers to these questions will, of course, vary; every business’s needs are different.
Our stack for acquiring and retaining customers
We’ve been building incident.io for 12 months and thought it would be a good time to share the constellation of tools that we’re using to power our customer experience.
The 11 Best Docker Alternatives In 2022
Automate Troubleshooting of Applications Running on Kubernetes
StackState is an out-of-the-box solution to observe your entire Kubernetes stack, identify problems, automatically highlight the changes that cause them and provide the full context you need for efficient and effective troubleshooting. Our clear and affordable pricing makes it easy to get started today.
Announcing issue-initiated Change Lead Time
Sleuth is pleased to announce a new option to start your Change Lead Time clock based on state transitions in your issue tracker! In our ongoing effort to meet customers where they are, we heard from many of you that you’d like Sleuth to account for and provide visibility into your pre-commit coding time. We’re pleased to offer this this new option to tell Sleuth which specific state transitions in your issue tracker should start your Change Lead Time clock!
Share secrets with standalone projects with project context restrictions
Introducing project context restrictions for GitLab organizations. This feature enables project-based restrictions on contexts for standalone projects that are not tied to a VCS. Standalone projects are available at this time only with a GitLab integration with CircleCI. In this blog post, we hope to explain the value of this feature and how it can be used to further secure your workflows.
Comprehensive Guide on Partitioning and Sharding in Azure Database for PostgreSQL
How to build an EKS kubernetes cluster with Ubuntu 20.04 on FIPS mode
Does accuracy matter for tracking DORA metrics?
You might be excited about tracking DORA metrics, but have you ever thought about the ways in which you track them, and how important accuracy is in your methods?
Collect traces, logs, and custom metrics from your Google Cloud Run services with Datadog
Google Cloud Run is a managed platform for the deployment, management, and scaling of workloads using serverless containers. You can deploy workloads in the cloud or, using Cloud Run for Anthos, on your on-prem infrastructure.
Why you should ditch your overly detailed incident response plan
When critical incidents happen — which they inevitably do 😅 — and you’re in the middle of trying to figure out what the best thing to do is, it can feel comforting to know that you’ve got a pre-prepared list of instructions to follow, commonly known as an “incident response plan”: In theory this sounds quite simple, and a typical flow you might envision is: It might be tempting to think that the hardest part of running incidents is finding or writing a checkl
How to Detect Anomalies and Why You Should Care
Companies today are relying on technology more than ever thanks to widespread digital transformation and cloud initiatives. And this is increasing the need for safe, efficient and reliable IT environments. But maintaining operational IT stability is very difficult when considering the complex and dynamic nature of today’s IT environments. In fact, IT environments are constantly changing, with new network devices, users and software versions coming into existence.
Platform.sh partners with MongoDB to help customers build modern applications faster
Today, we are excited to announce that Platform.sh now offers the latest version of MongoDB to our Enterprise and Elite customers. Clients can now enjoy improved visibility via one source of control, the ability to track multiple applications and users, and native, at-rest encryption that meets the latest security compliance standards. There are more details about the benefits of MongoDB below.
Kubernetes Node-to-node Networking - Civo Academy
More on the State of Kubernetes 2022 survey
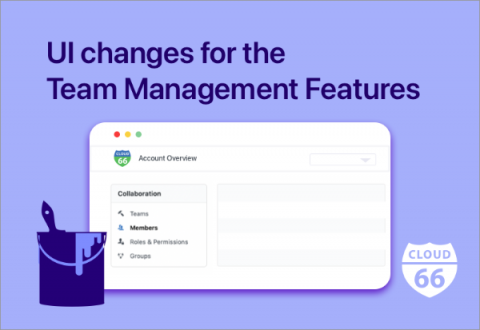
UI changes for the Team Management Features
Today we are happy to announce a new look to our account settings dashboard. Many of our customers work in teams, and we have many fantastic team management features to make their work easier. With our latest user interface changes, we have made the team and organization features more intuitive and easier to manage.
The Challenges of Multi-Cloud Management and How Observability Helps Solve Them
Aiven Terraform Provider - Getting Started
Announcing Incident watchers: Subscribe to incidents and receive incident updates in real-time
New reports stress the importance of strategic incident management practice
Engineers have been managing incidents for as long as they’ve been building software, but the idea of incident management as a strategic practice in its own right is still finding its place. We’re starting to see big shifts in that area, though — more companies are dedicating headcount, resources, and tools to help them better prepare for, respond to, and learn from their incidents.
Why is Open Source Important to Enterprise IT Leaders?
A recent global survey demonstrates the importance of open source tools and technologies to IT professionals and their organizations. In Foundry’s MarketPulse Survey for SUSE, 2022, more than 600 IT professionals from enterprises around the world shared their experience and opinions on cloud native technology and open source. The results? Sixty-three percent of those surveyed said it was highly important for their organizations to choose open source tools and technologies.
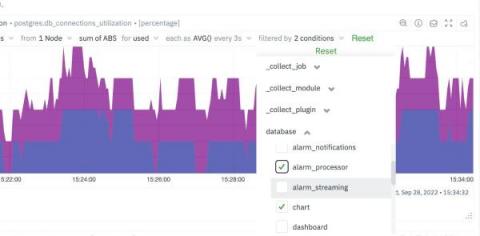
How to filter metrics by label?
It is sometimes easy to get lost in the mountain of metrics and infinite number of dimensions when working with an infrastructure monitoring tool. Being able to filter metrics by label and visualize only what is relevant to the current scope of monitoring & troubleshooting, becomes absolutely crucial to the success of SREs, Sysadmins and DevOps professionals.
Virtualization Technology | A Brief Overview
Rancher Desktop 1.6.0: With Troubleshooting Diagnostics and More
A new version of Rancher Desktop with a troubleshooting diagnostics feature and several other improvements has just been released!
VMware Tanzu Application Service 3.0 Now Generally Available
The next major release of VMware Tanzu Application Service is here. Tanzu Application Service is a modern application platform that enables enterprises to continuously deliver and run microservices across clouds, providing their application development teams with an automated path to production for custom code, while offering their operations teams a secure, highly available runtime.
What is PagerDuty Process Automation?
What Is a Firewall?
A firewall is a cybersecurity tool used to prevent unauthorized access to your private device or network. It could refer to any software or hardware that checks the data and traffic coming in and going out of a network to ensure they comply with cybersecurity rules. Firewalls can also include what is known as an intrusion detection system (IDS), which additionally blocks malicious traffic while allowing legitimate and authorized traffic access to a network.
RDS Pricing Explained: A 2022 Beginner-Friendly Guide
Pod to Pod Networking in Kubernetes - Civo Academy
Canonical launches Ubuntu Pro beta
Canonical launches free personal Ubuntu Pro subscriptions for up to five machines
Ubuntu Pro, the expanded security maintenance and compliance subscription, is now offered in public beta for data centres and workstations. Canonical will provide a free tier for personal and small-scale commercial use in line with the company’s community commitment and mission to make open source more easily consumable by everyone.
Missing indexes in PostgreSQL? How to quickly identify it
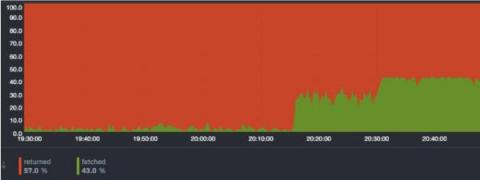
While working on improving the Netdata PostgreSQL collector, we were monitoring our production PostgreSQL instance and something caught our attention immediately. The rows fetched ratio seemed really, really low for one particular database… there were missing indexes in PostgreSQL! Rows fetched ratio is the percentage of rows that contain data needed to execute the query (rows fetched), out of the total number of rows scanned (rows returned).
Common Kubernetes Challenges in 2022 and How to Solve Them
This year’s VMware Explore saw a great deal of excitement from the multi-cloud community. It’s evident that organizations are seeking reliable ways to transform their businesses and become digitally smart. It’s also becoming increasingly more apparent that organizations are looking towards Kubernetes to help them do so. In fact, the State of Kubernetes 2022 report has shown us that not only is Kubernetes here to stay, but it’s growing at a rapid pace.
SRE Hiring Guide - Interview Questions and Skills to Look for
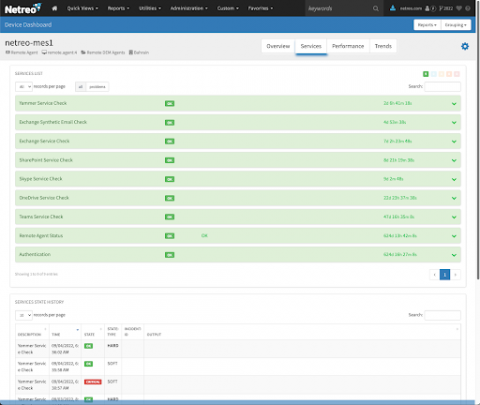
Keeping Your Microsoft 365 Estate In-Check with Netreo
Teams meeting not loading? Outlook mailbox not refreshing? Imagine starting Monday morning with either of the above two issues. It can certainly hinder anyone’s work schedule. Microsoft Teams, Sharepoint, Outlook and other Microsoft 365 services have become essential in day to day work life. An outage in any of these services causes panic among the workforce, followed by questions on whether the trouble is their system or the application.
Will Automation Replace the IT Workforce?
Atlassian DevOps Talks Fireside Chat with the CICD industry
Mattermost Channels Roadmap Updates | v7.3
Mattermost Boards Roadmap Updates | v7.2.1
Component testing vs unit testing
Testing is a vital part of the software development lifecycle. It plays an important role in the continuous integration/continuous deployment (CI/CD) pipeline, enabling developers to release dependable, resilient, and secure software consistently. There are many types of testing and testing methodologies: end-to-end testing, dynamic testing, integration testing, and others. This article focuses on component testing and unit testing.
Our Top 10 Kubernetes and Cloud Native Guides 2022
Since the beginning, our community has been at the forefront of what we do. Over the years, we have been able to highlight the knowledge and talent of our community by showcasing tutorials submitted to us via Write For Us. As we reach the end of 2022, we wanted to highlight some of our top guides from the Civo community that were published throughout the year.
Kubernetes Jobs Deployment Strategies in Continuous Delivery Scenarios
Continuous Delivery (CD) frameworks for Kubernetes, like the one created by Rancher with Fleet, are quite robust and easy to implement. Still, there are some rough edges you should pay attention to. Jobs deployment is one of those scenarios where things may not be straightforward, so you may need to stop and think about the best way to process them. We’ll explain here the challenges you may face and will give some tips about how to overcome them.
Measuring Developer Productivity: Can, How, and Should You Do It?
Productivity is a big topic. We all want to be more productive — and software developers in particular get put under the microscope. Interestingly, their work is also particularly difficult to measure and assess what “productive” even is. But we need to do it because we want developers to be more productive — and happier — because we want to achieve business goals together, better.
Monitoring Kubernetes with Hosted Graphite by MetricFire
In this article, we will be looking into Kubernetes monitoring with Graphite and Grafana. Specifically, we will look at how your whole Kubernetes set-up can be centrally monitored through Hosted Graphite and Hosted Grafana dashboards. This will allow Kubernetes Administrators to centrally manage all of their Kubernetes clusters without setting up any additional infrastructure for monitoring.
Building great developer experience at a startup
At incident.io, our number one priority in engineering is pace. The faster we can build great product, the more feedback we can get and the more value we can deliver for our customers. But pace is a funny thing. If you optimise for pace over a single month, you’ll quickly find yourself slowed down by the weight of your past mistakes.
Kubeflow 1.6 on Kubernetes 1.23 and beyond
Kubeflow is an open-source MLOps platform that runs on top of Kubernetes. Kubeflow 1.6 was released September 7 2022 with Canonical’s official distribution, Charmed Kubeflow, following shortly after. It came with support for Kubernetes 1.22. However, the MLOps landscape evolves quickly and so does Charmed Kubeflow. As of today, Canonical supports the deployment of Charmed Kubeflow 1.6 on Charmed Kubernetes 1.23 and 1.24.
Kubernetes alternatives to Spring Java framework
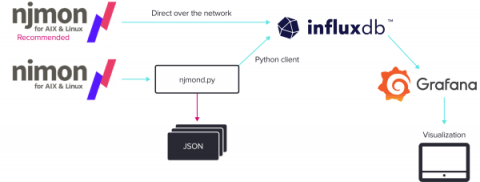
Reimagining nmon Using InfluxDB
IBM engineer Nigel Griffiths built nmon in the 1990s to monitor operating system performance data for AIX. Since its original launch, Griffiths revisited and revamped nmon. For example, he built an open-source version for Linux. Despite drastic change in the very nature of computing and exponential growth in storage, memory, and compute power, it wasn’t until 2018 that Griffiths sought to completely re-write the tool and bring it into alignment with modern computer systems.
The Monitoring Problem: Too Many Tools + Too Much Time = No Room for Innovation
Continuous availability and unceasing innovation are prerequisites for today’s digital businesses. So it makes sense that business leaders invest heavily in teams and tools to monitor digital apps and services. In theory, these tools should also free up time for engineers to push new functionalities that wow customers. But do these investments actually result in more uptime and customer-delighting innovations?
An Introduction to gRPC
gRPC is an inter-process communication protocol used in high-performance applications in cloud computing, Internet of Things (IoT), mobile computing, and microservices environments. This article examines how gRPC works, how to use it, and how it compares to other popular API architectures. It also discusses a unique use case where gRPC excels.
Top Three Kubernetes Myths: What C-Level Executives Should Know
In the past few years, we’ve seen a rapid increase in container adoption as the go-to strategy for accelerating software development. After all, why wouldn’t you move towards containerization considering its advantages? Benefits such as application portability, IT resource efficiency, and increased agility would make any infrastructure or operations leader interested in adopting containers with Kubernetes.
Meet Epinio: The Application Development Engine for Kubernetes
Epinio is a Kubernetes-powered application development engine. Adding Epinio to your cluster creates your own platform-as-a-service (PaaS) solution in which you can deploy apps without setting up infrastructure yourself. Epinio abstracts away the complexity of Kubernetes so you can get back to writing code. Apps are launched by pushing their source directly to the platform, eliminating complex CD pipelines and Kubernetes YAML files.
Network Security - Making Sure VoIP Is Not A Security Risk
CI/CD for Unity game development with GameCI's Unity orb
We recently partnered with GameCI to bridge the gap between CircleCI and the game development scene. This partnership brought forth the Unity orb, a reusable component of config you can plug into your CircleCI configuration file to build and test your Unity projects. For a while now, continuous integration and delivery have been part of the software development cookbook of several software houses and IT departments. However, this is often not the case in game development.
Container to Container Networking - Civo Academy
3DS OUTSCALE uses Megaport to Unlock Cloud Potential
3DS OUTSCALE aims to provide local cloud services with global reach.
How Cortex can help you get the most out of Datadog
CI/CD Testing Done Properly (Agile Testing)
CI/CD is a way of developing software and deploying it so that changes occur quickly, frequently, and with high quality. It has become increasingly important as organizations move towards digital transformation and the need for instant feedback on ideas or products. Agile testing is an approach to testing software where you write tests first and then develop code around those tests.
Device discovery: The path to total network visibility
For an organization to prevent cyberattacks, it first needs complete visibility into all the events that occur within its network. With this visibility, the organization can analyze risky behavior by users and entities, and take the necessary steps to proactively secure itself. However, if an attack were to still happen, the organization again needs complete visibility to identify how and from where the attacker entered the network.
Zadara and Green Mountain Announce Technology Partnership to Accelerate Edge Cloud Adoption in the Nordic Market
Q3 2022 product retrospective - Last quarter's top features
Qovery V3 Beta is Out
Fundamentals: What Sets Containers Apart from Virtual Machines
Containers have fast become one of the most efficient ways of virtually deploying applications, offering more agility than a virtual machine (VM) can typically provide. Both containers and VMs are great tools for managing resources and application deployment, but what is the difference between the two, and how do we manage containers?
Civo Update - October 2022
In September, we announced that Steve Wozniak will be joining us at Civo Navigate to discuss his time at Apple and share his thoughts on the future of technology. Grab your tickets for Civo Navigate today! We also hosted the Cloud Native Community meetup in Florida where we had talks from Mark Boost, CEO at Civo, Kunal Kushwaha, Dev Rel Manager at Civo, and a guest speaker from Defense.com speaking about security.
Demystifying the complexity of cloud-native 5G network functions deployment using Robin CNP - Part I
Robin.io simplifies the operations and lifecycle management of 5G applications at scale and demystifies the complexity around 5G and network functions management. The simplified end-to-end automation and App-Store-like user interface makes the management of applications easy for operators. This is relevant for several reasons.
The top 5 benefits of peering
Making Decisions In The Cloud: Data Vs. Information Vs. Intelligence
IoT project lifecycle - long-term support for IoT devices [Part III]
How long will you support your device? Long-term support for IoT is a simple but difficult question for many device manufacturers. If you are developing a smart home device, a mobile robot for hospitality, or the next iron man jetpack, you need to consider how long you will support the device on the market. This will have implications on your operational expenses, team resources and customer satisfaction. Simply put, the longer you support your device, the happier your user will be.
How Puppet is making platform engineering more secure
As platform engineering continues to rise in popularity, there is a new side effect to watch out for: the people using the internal developer platforms aren't the people who built it. They’re not necessarily familiar with the codebase, they may not know what's powering it behind the scenes – and the platform might even have to contend with malicious users. So how is Puppet evolving to contend with this new challenge?
Introducing Squadcast Premium
There's a better way: how an incident management tool helps you conquer response challenges
As a solutions engineer for FireHydrant, I speak with a wide variety of companies about their incident management programs — from start-ups with a handful of employees to large enterprise companies with thousands of engineers. Whether they’re looking to establish their incident management program or mature it, the same questions remain.
Accelerating Application Development on Kubernetes with Tanzu Application Platform
Mphasis is a trusted VMware services partner and is a participating member of the Tanzu Partner Advisory Council. They’ve also participated in the Tanzu Application Platform Design Partner Program, which afforded them the unique opportunity to influence the future of VMware Tanzu Application Platform, by having first access to features before the general release and by providing valuable feedback to VMware’s product teams about both the developer and operator experiences.
The Dangers of Unspecified Kubernetes Resources
Monitoring Strategies: An Introductory Guide With 5 Examples
Monitoring is an integral part of most organizations. The monitoring process usually consists of several tools that, combined, show you information about whatever you're monitoring - applications, infrastructure, networks and so forth. While monitoring may seem like an obvious practice to some, it can be challenging to establish the best monitoring strategy for your organization.
An Introduction to Kubernetes Networking - Civo Academy
Fixing Slow Databases: Improving App Performance Overnight
5 Microservices Challenges and Blindspots for Developers
Microservices are loosely coupled services that are organized around business capabilities. In an ideal microservices architecture, each service can be developed and deployed independently. To form a functional application, these separate services communicate with each other in the production environment (and even beforehand).
Platform Engineering: Explained, Benefits, and How to Get Started?
Security Best Practices at MetricFire
At MetricFire, we treat your data as our data, and we secure our data. Security is prioritized at every level of our infrastructure so you can have peace of mind that your data is sent and stored safely. Keeping MetricFire secure is fundamental to the nature of our business. One of our key priorities is to secure our customers’ metrics and trust. We diligently ensure that we comply with industry security standards so that our customers can trust that their metrics are safeguarded.


