Operations | Monitoring | ITSM | DevOps | Cloud
March 2021
Integrating Logging into CI/CD
Getting Started with Elastic Cloud: A FedRAMP Authorized Service
Elastic Cloud is available for US government users and partners who want to harness the power of enterprise search, observability, and security to make mission-critical decisions. Elastic Cloud is FedRAMP authorized at Moderate Impact level so federal organizations and other customers in highly regulated environments can quickly and easily search their applications, data, and infrastructure for information, analyze data to observe insights, and protect their technology investment.
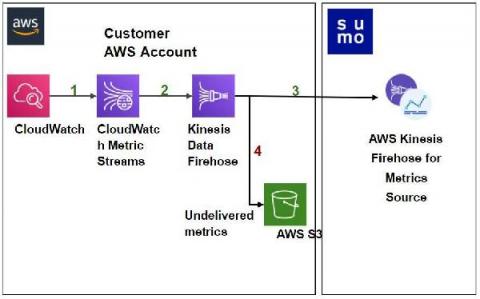
Sumo Logic joins AWS to accelerate Amazon CloudWatch Metrics collection
The Untapped Power of Key Marketing Metrics
Marketing and Site Reliability teams rarely meet in most organizations. It’s especially rare outside the context of product marketing sessions or content creation. With observability now pivotal to success, we should be looking to bring the two together for technical and commercial gains. In this piece, we’re going to explore the meaning of observability and its relevance to marketing metrics.
Unlocking Hidden Business Observability with Holistic Data Collection
Why do organizations invest in observability? Because it adds value. Sometimes we forget this when we’re building our observability solutions. We get so excited about what we’re tracking that we can lose sight of why we’re tracking it. Technical metrics reveal how systems react to change. What they don’t give is a picture of how change impacts the broader business goals. The importance of qualitative data in business observability is often overlooked.
Explore Prometheus Metrics with Logz.io Infrastructure Monitoring
Metrics Explore is the Logz.io feature for deep dives into Prometheus metrics. Similar to Kibana Discover, it allows for easy querying, pull-down list selections, and other ways to navigate your data. Best yet, you can explore important metadata for detailed metric analysis. There are a few ways to move around the metrics in your system. Get started by finding the Explore icon on the left-hand menu.
Micro Lesson: Managing Access Keys (Conceptual)
Micro Lesson: Planning Your Use of Data Tiers
Micro Lesson: Administering Password Policy and Service Allowlist Settings
Data Lake Opportunities: Rethinking Data Analytics Optimization [VIDEO]
Data Lake Challenges: Or, Why Your Data Lake Isn't Working Out [VIDEO]
Coralogix - On Demand Webinar - 2021 Troubleshooting Best Practices
Cloud SIEM: Modernize Security Operations and your Cyber Defense
Which Event Log Events Should You Worry About?
When you are configuring your event log monitor settings, you need to decide which event log events you need to worry about. Event logs are generated for a wide array of processes, applications, and events. Logs will record both successes and failures. As such, you need to decide what data is most vital and needs your immediate attention.
Why We Chose the M3DB Data Store for Logz.io Prometheus-as-a-Service
Logz.io is focused on creating the best observability service to manage the scale of monitoring, add value on top of AI/ML technologies, and enhance enterprise security. Metrics is one of the pillars of Logz.io, and our Prometheus-as-a-Service offering. It has been a crucial part of our platform goals, but if we turn the clocks back a year, our service only used the open-source Elasticsearch database (ES).
Finding the Bug in the Haystack: Hunting Down Exceptions in Production
Software companies are in a constant pursuit to optimize their delivery flow and increase release velocity. But as they get better at CI/CD in the spirit of “move fast and break things,” they are also being forced to have a very sobering conversation about “how do we fix all those things we’ve been breaking so fast?” As a result, today’s cloud-native world is fraught with production errors, and in dire need of observability.
Monitoring Logs for Insider Threats During Turbulent Times
For logs and tracking insider threats, you need to start with the relevant data. In these turbulent times, IT teams leverage centralized log management solutions for making decisions. As the challenges change, the way you’re monitoring logs for insider threats needs to change too. Furloughs, workforce reductions, and business practice changes as part of the COVID stay-at-home mandates impacted IT teams.
How I fell in love with logs thanks to Grafana Loki
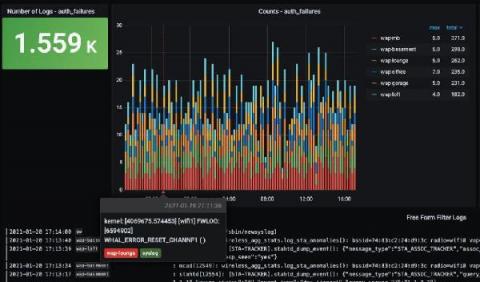
As part of my job as a Senior Solutions Engineer here at Grafana Labs, I tend to pretty easily find ways out of technical troubles. However, I was recently having some Wi-Fi issues at home and needed to do some troubleshooting. My experience changed my whole opinion on logs, and I wanted to share my story in hopes that I could open up some other people’s eyes as well. (I originally posted a version of this story on my personal blog in January.) First, some background info.
High throughput VM logging and metrics agent now in Preview
Running and troubleshooting production services requires deep visibility into your applications and infrastructure. Virtual machines running on Google Compute Engine (GCE) provide some system logs and metrics without any configuration required, but capturing application and advanced system data has required the installation of both a metrics agent and a logging agent.
Splunk Dashboard Studio Demo
Uniting Tracing and Logs With OpenTelemetry Span Events
The current landscape of what our customers are dealing with in monitoring and observability can be a bit of a mess. For one thing, there are varying expectations and implementations when it comes to observability data. For another, most customers have to lean on a hodgepodge of tools that might blend open source and proprietary, require extensive onboarding as team members have to learn which tools are used for what, and have a steep learning curve in general.
Elastic 7.12 released: General availability of schema on read, technical preview of the frozen tier, and support for autoscaling
We are pleased to announce the general availability (GA) of Elastic 7.12. This release brings a broad set of new capabilities to our Elastic Enterprise Search, Observability, and Security solutions, which are built into the Elastic Stack — Elasticsearch and Kibana.
Directly search S3 with the new frozen tier
We’re thrilled to announce the technical preview of the frozen tier in 7.12, enabling you to completely decouple compute from storage and directly search data in object stores such as AWS S3, Microsoft Azure Storage, and Google Cloud Storage. The next major milestone in our data tier journey, the frozen tier significantly expands your data reach by storing massive amounts of data for the long haul at much lower cost while keeping it fully active and searchable.
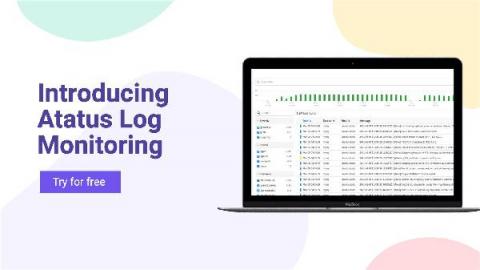
Introducing Atatus Log Monitoring
Log Monitoring is a crucial step in ensuring to know what’s happening in all your servers from a single location. Did you know Log Monitoring tools are implemented by the strategy called “defense-in-depth”? Boom!!! That’s where the log monitoring concept developed, and now we have many log monitoring tools in the market. Issues that users face in the log monitoring tool: We considered all the above points while we designed our tool.
Tutorial | How to create LogDNA Alerts
Tutorial | How to Set Up LogDNA Ingestion Source
Tutorial | How to Custom Parsing with LogDNA
Tutorial | How to use LogDNA Screens
Aggregating Application Logs From EKS on Fargate
Elastic recognized as a Challenger in the 2021 Gartner Magic Quadrant for Insight Engines
We’re excited to announce that, as a new entrant in the 2021 Gartner Magic Quadrant for Insight Engines, Elastic has been recognized as a Challenger. You can download the complimentary report today. Read on to learn more about creating powerful, modern search experiences with Elastic Enterprise Search.
Now is the time for Sumo!
Microservices vs. Serverless Architecture
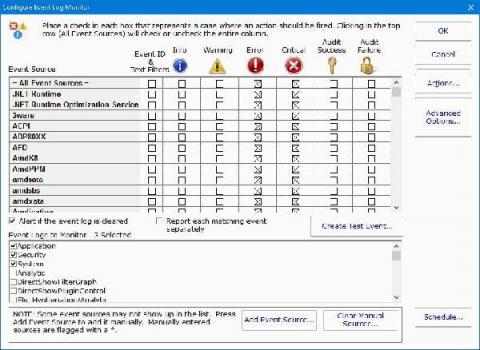
How to Configure PA Server Monitor to Monitor Your Event Logs
Did you know that you could configure PA Server Monitor’s Event Log Monitor feature to monitor one or more of your event logs? The event logs can include standard application, security, and system logs, as well as any custom event logs you want to monitor. With our server monitoring software, you have complete control and flexibility over the types of events you want to monitor.
Logz.io Infrastructure Monitoring Demo
Monitoring Windows Event Logs - Getting Started
Windows event logs are important for security, troubleshooting, and compliance. When you analyze your logs, you can monitor and report on file access, network connections, unauthorized activity, error messages, and unusual network and system behavior. However, Windows servers produce tens of thousands of log entries every day.
How to Understand Log Levels
More than once, I’ve heard experienced software developers say that there are only two reasons to log: either you log Information or you log an Error. The implication here is that either you want to record something that happened or you want to be able to react to something that went wrong. In this article, we’ll take a closer look at logging and explore the fact that log levels are more than just black or red rows in your main logging system.
Hunting for Lateral Movement using Event Query Language
Lateral Movement describes techniques that adversaries use to pivot through multiple systems and accounts to improve access to an environment and subsequently get closer to their objective. Adversaries might install their own remote access tools to accomplish Lateral Movement, or use stolen credentials with native network and operating system tools that may be stealthier in blending in with normal systems administration activity.
Infrastructure Monitoring Tutorial: Getting Started Sending Prometheus Metrics
This Logz.io Infrastructure Monitoring tutorial will cover how to get started with our latest product, our new Prometheus-as-a-Service metrics solution that’s based on Prometheus. Engineers monitor metrics to understand CPU and memory utilization for infrastructure, duration and serverless execution, or for network traffic. For more advanced metrics monitoring operations, teams can send custom metrics to monitor signals like the number of active users.
Power of Search
DevSecOps is a Practice. Make it visible.
Logz.io's Prometheus-as-a-Service is Generally Available
Today, Logz.io is thrilled to announce that Prometheus-as-a-service is now generally available for anyone to try themselves! I’d like to thank the Logz.io village for executing a huge milestone on our quest to unify the best open source monitoring tools on Logz.io’s scalable cloud platform.
Making Your Log Data More Useful With LM Logs
To prevent failure and minimize downtime, it’s important to make sure your infrastructure and applications are observable. But, just getting to the point of observability isn’t enough. You need to be able to use the data that comes with observability — ideally in a way that helps your team troubleshoot more quickly and minimize or prevent downtime.
What to Consider When Monitoring Hybrid Cloud Architecture
Hybrid cloud architectures provide the flexibility to utilize both public and cloud environments in the same infrastructure. This enables scalability and power that is easy and cost-effective to leverage. However, an ecosystem containing components with dependencies layered across multiple clouds has its own unique challenges. Adopting a hybrid monitoring strategy doesn’t mean you need to start from scratch, but it does require a shift in focus and some additional considerations.
How Microsoft Used Splunk's Ethlogger to Turn Blockchain Data Into Supply Chain Insight
The way we ‘data’ is about to change, and Splunk’s Connect for Ethereum (aka EthLogger) is helping organizations to adapt. Splunk Connect for Ethereum enables organizations of all sizes to investigate, monitor, analyze and act upon their rapidly growing blockchain data sets across multiple chains.
Getting Started with OpenTelemetry .NET and OpenTelemetry Java v1.0.0
Recently we announced in our blog post, "The OpenTelemetry Tracing Specification Reaches 1.0.0!," that OpenTelemetry tracing specifications reached v1.0.0 — offering long-term stability guarantees for the tracing portion of the OpenTelemetry clients. Today we’re excited to share that the first of the language-specific APIs and SDKs have reached v1.0.0 starting with OpenTelemetry Java and OpenTelemetry .NET.
Elastic Cloud Value Calculator: Understand the economics of adopting Elastic Cloud
As your Elastic usage increases and your use cases expand, it's important to know the benefits and cost savings that you can achieve by running Elasticsearch as a service. But since every Elasticsearch implementation can vary by use case and deployment model, it can be complicated to tackle on your own. So with that in mind, we are excited to share the Elastic Cloud Value Calculator.
Two Major Industry Awards Confirm ChaosSearch's Growing Role in Enterprise Cybersecurity
Visual Link Analysis with Splunk: Part 4 - How is this Pudding Connected?
I thought my last blog, Visual Link Analysis with Splunk: Part 3 - Tying Up Loose Ends, about fraud detection using link analysis would be the end of this topic for now. Surprise, this is part 4 of visual link analysis. Previously (for those who need a refresher) I wanted to use Splunk Cloud to show me all the links in my data in my really big data set. I wanted to see all the fraud rings that I didn’t know about. I was happy with my success in using link analysis for fraud detection.
Splunking AWS ECS And Fargate Part 3: Sending Fargate Logs To Splunk
Welcome to part 3 of the blog series where we go through how to forward container logs from Amazon ECS and Fargate to Splunk. In part 1, Splunking AWS ECS Part 1: Setting Up AWS And Splunk, we focused on understanding what ECS and Fargate are, along with how to get AWS and Splunk ready for log routing to Splunk’s Data-to-Everything Platform.
Logback Configuration Example: Tutorial on How to Use It for Logging in Java
Troubleshooting issues in your applications can be a complicated task requiring visibility into various components. In the worst-case scenario, to understand what is happening and why it is happening you will need metrics, logs, and traces combined together. Having that information will give you the possibility to slice and dice the data and get to the root cause efficiently. In this article, we will focus on logs and how to configure logging for your Java applications.
Micro Lesson: Share a Dashboard (New) Inside Your Organization
Micro Lesson: Administering Policies (CloudFlex)
Setting Up the AWS Observability Solution
SLF4J Tutorial: Example of How to Configure It for Logging Java Applications
Logging is a crucial part of the observability of your Java applications. Combined with metrics and traces gives full observability into the application behavior and is invaluable when troubleshooting. Logs, combined with metrics shortens the time needed to find the root cause and allows for quick and efficient resolutions of problems.
Log4j 2 Configuration Example: Tutorial on How to Use It for Efficient Java Logging
When it comes to troubleshooting application performance, the more information you have the better. Logs combined with metrics and traces give you full visibility into your Java applications. Logging in your Java applications can be achieved in multiple ways – for example, you can just write data to a file, but there are far better ways on how to do that, as we explained in our Java logging tutorial.
The Top Query Languages You Should Know for Monitoring (and a couple more)
Sifting data can be fun for some people. Connecting the dots and finding correlations where they weren’t obvious before. It’s the crux of what drives people’s motivation in data science. It’s no different in any other field, especially in one involving systems observability, telemetry, or monitoring. And the best way to do that is to develop a fluency with query languages for different database structures and open source tools.
Validating Elastic Common Schema (ECS) fields using Elastic Security detection rules
The Elastic Common Schema (ECS) provides an open, consistent model for structuring your data in the Elastic Stack. By normalizing data to a single common model, you can uniformly examine your data using interactive search, visualizations, and automated analysis. Elastic provides hundreds of integrations that are ECS-compliant out of the box, but ECS also allows you to normalize custom data sources. Normalizing a custom source can be an iterative and sometimes time-intensive process.
Hafnium Hacks Microsoft Exchange: Who's at Risk?
Microsoft recently announced a campaign by a sophisticated nation-state threat actor, operating from China, to exploit a collection of 0-day vulnerabilities in Microsoft Exchange and exfiltrate customer data. They’re calling the previously unknown hacking gang Hafnium. Microsoft has apparently been aware of Hafnium for a while — they do describe the group’s historical targets.
ON-DEMAND: ScaleUP Security 2021
How to manage Elasticsearch data across multiple indices with Filebeat, ILM, and data streams
Indices are an important part of Elasticsearch. Each index keeps your data sets separated and organized, giving you the flexibility to treat each set differently, as well as make it simple to manage data through its lifecycle. And Elastic makes it easy to take full advantage of indices by offering ingest methods and management tools to simplify the process.
Efficiently Monitor the State of Redis Database Clusters
VPN and Firewall Log Management
The hybrid workforce is here to stay. With that in mind, you should start putting more robust cybersecurity controls in place to mitigate risk. Virtual private networks (VPNs) help secure data, but they are also challenging to bring into your log monitoring and management strategy. VPN and firewall log management gives real-time visibility into security risks. Many VPN and firewall log monitoring problems are similar to log management in general.
Detecting threats in AWS Cloudtrail logs using machine learning
Cloud API logs are a significant blind spot for many organizations and often factor into large-scale, publicly announced data breaches. They pose several challenges to security teams: For all of these reasons, cloud API logs are resistant to conventional threat detection and hunting techniques.
Forrester TEI study: Sumo Logic's Cloud SIEM delivers 166 percent ROI over 3 years and a payback of less than 3 months
Sumo Logic Continues to expand Public Sector Footprint
Splunk SOAR Playbooks: Crowdstrike Malware Triage
A closer look at the admin API and plugin for centralized tenant adminstration and control in Grafana Enterprise Logs
To follow up on our introduction of Grafana Enterprise Logs, the latest addition to the Grafana Enterprise Stack, let’s dig into one of the key features: the admin API and admin plugin. Grafana Loki, Grafana Labs’ log aggregation project, provides the underpinnings of Grafana Enterprise Logs (GEL).
Pinpointing a Memory Leak For an Application Running on DigitalOcean
Logging in Ruby with Logger and Lograge
Logging is tricky. You want logs to include enough detail to be useful, but not so much that you're drowning in noise - or violating regulations like GDPR. In this article, Diogo Souza introduces us to Ruby's logging system and the LogRage gem. He shows us how to create custom logs, output the logs in formats like JSON, and reduce the verbosity of default Rails logs.
Laravel Monolog Handler for Logflare
For our API, we’ve been happily using NewRelic’s monolog enricher for a while, which sends our application logs to NewRelic at the end of each request, making it light and fast for our system not to be bothered by it. Until it stopped working with the upgrade to Composer 2, and they knew about it for several months and still didn’t do a single thing to fix it. So I decided to move to Logflare. Logflare is a fast, light, scalable, and powerful logging aggregator.
Best practices for monitoring Microsoft Azure platform logs
Microsoft Azure provides a suite of cloud computing services that allow organizations across every industry to deploy, manage, and monitor full-scale web applications. As you expand your Azure-based applications, securing the full scope of your cloud resources becomes an increasingly complex task. Azure platform logs record the who, what, when, and where of all user-performed and service account activity within your Azure environment.
Micro Lesson: Partitions Basics (New UI)
Tutorial: Set Up a Windows JSON Source
Elastic + Grafana Labs partner on the official Grafana Elasticsearch plugin
Today, I’m happy to share more about our partnership and commitment to our users that they will have the best possible experience of both Elasticsearch and Grafana, across the full breadth of Elasticsearch functionality, with dedicated engineering from both Grafana Labs and Elastic. Through joint development of the official Grafana Elasticsearch plugin users can combine the benefits of Grafana’s visualization platform with the full capabilities of Elasticsearch.
A Picture is Worth a Thousand Logs
Splunk is a fantastic platform for ingesting, storing, searching and analysing data from logs, metrics and traces from a massive variety of sources. But does that mean we should ignore all of that data that doesn’t fall into these categories, like image and video data for example? Of course not!
Observability and Monitoring for Modern Applications
I drive a 2005 Ford diesel pickup truck. Most of the time my truck runs great. But occasionally an orange light on the dashboard will flicker on to alert me that something is wrong. Unfortunately, there’s no information about what is wrong and why. My truck has a monitoring solution, but not an observability solution. In many cases, IT has the same problem as my truck.
Observability vs. Monitoring: What's the Difference?
Service Map & Dashboards Provide Insight into Health and Dependencies of Microservice Architecture
Centralized Log Management for Cloud Streamlines Root Cause Analysis
Cloud services make the daily tasks of business easier. They enable remote workforce collaboration, streamline administrative tasks, and reduce capital costs. However, these “pros” come with a few “cons.” The IT stack’s increased complexity means staff work across divergent log management tools when something breaks. Centralized log management for the cloud makes root cause analysis easier by aggregating all event log data in a single location.
Control Your Logging Spend With Usage Quotas
We built LogDNA around the idea that developers are more productive when they have access to all of the logs they need, when they need them. However, we also know that log management can get expensive fast. And, for anyone who owns the budget for developer tools, logs can be an unpredictable line item as you try to determine your monthly, quarterly or even annual spend.
Kubernetes Logging Simplified - Pt 1: Applications
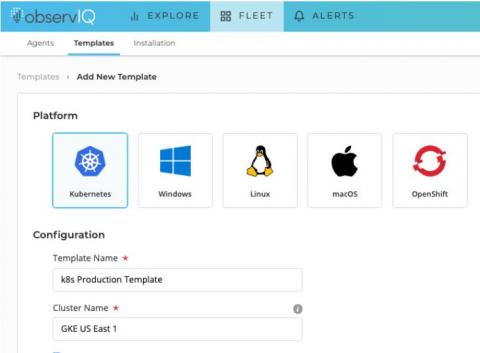
If you’re running a fleet of containerized applications on Kubernetes, aggregating and analyzing your logs can be a bit daunting if you’re not equipped with the proper knowledge and tools. Thankfully, there’s plenty of useful documentation to help you get started; observIQ provides the tools you need to gather and analyze your application logs with ease.
ChaosSearch Overview 3 min March 4 2021
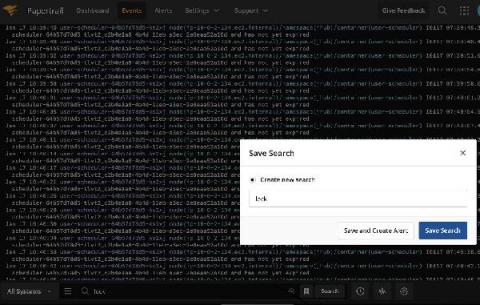
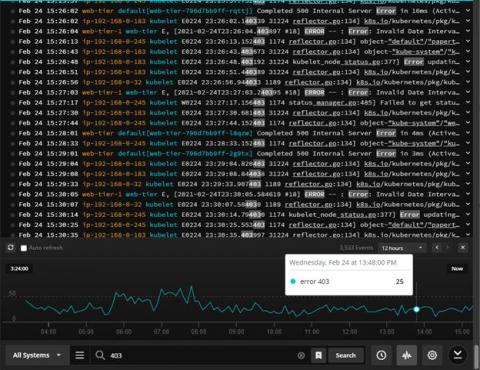
Debugging Development Logs with Papertrail and rKubeLog
SQL Sentry Events Log Updates Provide a Centralized View of Events
Security operations center, Part 3: Finding your weakest link
Any organization with data assets is a possible target for an attacker. Hackers use various forms of advanced cyberattack techniques to obtain valuable company data; in fact, a study by the University of Maryland showed that a cyberattack takes place every 39 seconds, or 2,244 times a day on average. This number has increased exponentially since the COVID-19 pandemic forced most employees to work remotely, and drastically increased the attack surface of organizations around the world.
Analyze your tracing data any way you want with Sumo search query language
The Cost of Racing Toward Success
LogDNA recently celebrated 5 years since our launch in Y Combinator and during this half-a-decade we’ve learned several lessons about balancing cost and scalability. As a founder, here are the top 3 things I wish someone had told me as we were racing towards success. The appeal of building a cloud-native application for a startup is a no brainer—it’s agile, scalable, and can be managed by a distributed team. Not to mention, it’s the cheapest way to get off the ground.
Accelerate your logs investigations with Watchdog Insights
If you’re investigating an incident, every minute means degraded performance or even downtime for customers. The causes of an issue often come from parts of your systems and applications that you would not think to check, and the sooner you can bring these to light, the better.
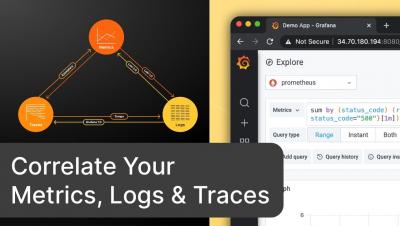
Correlate Your Metrics, Logs & Traces with the curated OSS observability stack from Grafana Labs
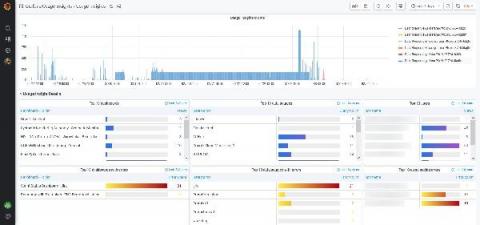
New in Grafana 7.4: Export usage data to Loki to help manage dashboard sprawl and troubleshoot faster
We first released the usage insights Enterprise feature in Grafana 7.0 based on feedback from customers that they would like to better understand how their users are interacting with Grafana, including the dashboards they visit, the information they query, and where they run into issues. What we learned was that dashboard sprawl is a real issue: Administrators estimate that almost 60% of dashboards might not be used at all.
All together now: Bringing your GKE logs to the Cloud Console
Troubleshooting an application running on Google Kubernetes Engine (GKE) often means poking around various tools to find the key bit of information in your logs that leads to the root cause. With Cloud Operations, our integrated management suite, we’re working hard to provide the information that you need right where and when you need it. Today, we’re bringing GKE logs closer to where you are—in the Cloud Console—with a new logs tab in your GKE resource details pages.
Metricbeat Deep Dive: Hands-On Metricbeat Configuration Practice
Metricbeat, an Elastic Beat based on the libbeat framework from Elastic, is a lightweight shipper that you can install on your servers to periodically collect metrics from the operating system and from services running on the server. Everything from CPU to memory, Redis to NGINX, etc… Metricbeat takes the metrics and statistics that it collects and ships them to the output that you specify, such as Elasticsearch or Logstash.
Doubling Down: What It's Like Contributing to Open Source at Logz.io
Logz.io has always prided itself as a company pushing the use of open source tech. As we have moved to expand our reach with metrics and traces over the past year and a half, we have doubled down on our own contributions to the community. With (distributed) traces in particular, we have been able to forge ahead. Our relationship with the teams at Jaeger and OpenTelemetry have really blossomed (and we are kind of proud to have supported the latter in the run-up to the OpenTelemetry v1.0 release).
Exploring the Value of your Google Cloud Logs and Metrics
With our ability to ingest GCP logs and metrics into Splunk and Splunk Infrastructure Monitoring, there’s never been a better time to start driving value out of your GCP data. We’ve already started to explore this with the great blog from Matt here: Getting to Know Google Cloud Audit Logs. Expanding on this, there’s now a pre-built set of dashboards available in a Splunkbase App: GCP Application Template for Splunk!
Analyze JMX to Better Assess The Health Of Your Java Applications
observIQ Cloud Product Brief
Logging Errors in Web Workers
Release 3.8.0 of the TrackJS browser agent added support for Web Workers, which adds some awesome new observability to the background tasks of your web applications. Many development teams have adopted Web Workers to their web applications to add offline support, caching, or to process heavy tasks. Workers allow web apps to feel faster by removing work from the user interface thread.


