Operations | Monitoring | ITSM | DevOps | Cloud
August 2021
Sumo Logic Red Hat Marketplace Operator
Bolster OT Security with Graylog
Anyone tracking the evolution of the IT industry is probably familiar with the concept of Industry 4.0. Essentially, it describes the process by which traditional industrial tasks become both digitized and continually managed in an IT-like fashion via modern technologies like cloud computing, digital twins, Internet of Things (IoT) sensorization, and artificial intelligence/machine learning.
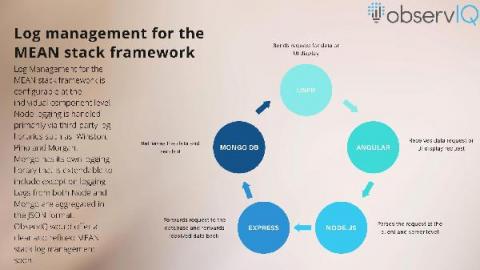
Log Management for the MEAN Stack Framework
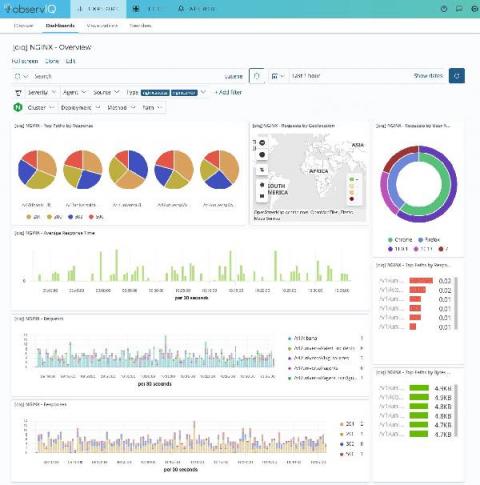
MEAN is evolving as a popular web stack for developing cloud native applications because of its scalability, ease of extension, and high reliability. Each component in MEAN is built on JavaScript, contributing to a cohesive development platform. In this post, we take you through the log management options that are available for each component of the MEAN stack framework and their respective limitations – limitations that are addressable with a refined log management solution like observIQ.
Metric Alerts
Robotic Data Automation (RDA): Reducing Costs and Improving Efficiencies of Your Log Management Investment
Query your nginx/envoy/syslog logs easier and way faster with the new Grafana Loki pattern parser.
Logging Best Practices: Knowing What to Log
First of all, don’t ask this! Instead of asking what to log, we should start by asking “what questions do we want to answer?” Then, we can determine which data needs to be logged in order to best answer these questions. Once a question comes up, we can answer it using only the data and knowledge that we have on hand. In emergent situations such as an unforeseen system failure, we cannot change the system to log new data to answer questions about the current state of the system.
The "Perfect" Log Management Solution Is Invisible
It sounds like a wild claim, considering that billion dollar companies like Splunk, Datadog, New Relic, and Solarwinds are consistently making national headlines, for both good and bad reasons. Observability leaders are anything but invisible, so how can the perfect solution be different? Are they that far off?
Docker Compose on Raspberry Pi4
Get your AWS CloudWatch data in!
How to Determine Whether an Error is Really an Error
There is nothing worse than waking up to an angry customer complaining that your website is failing to accept their payment at checkout. This may be worrying for some since payments not being processed can be equivalent to losing money; however with Tag Spotlight, this should be a relatively quick problem to dissect. The key question here is whether this is an issue that all our customers are facing or an isolated event.
Troubleshooting Cloud Services and Infrastructure with Log Analytics
.NET Error Logging Best Practices
Following best practices when logging helps make sure they contain the right information when needed. Some common best practices for logging errors in.NET are listed below.
Understand your services with Cloud Logging
What's New In 4.1
Elastic and Cmd join forces to help you take command of your cloud workloads
We are excited to announce that Elastic is joining forces with Cmd to accelerate our efforts in Cloud security - specifically in cloud workload runtime security. By integrating the capabilities of Cmd's expertise and product into Elastic Security, we will enable customers to detect, prevent, and respond to attacks on their cloud workloads.
How to Monitor Your AWS Workloads
A WS is a comprehensive platform with over 200+ types of cloud services available globally. As organizations adopt these services, monitoring their performance can seem overwhelming. The majority of AWS workloads behind the scenes are dependent on a core set of services: EC2 (the compute service), EBS (block storage), and ELB (load balancing).
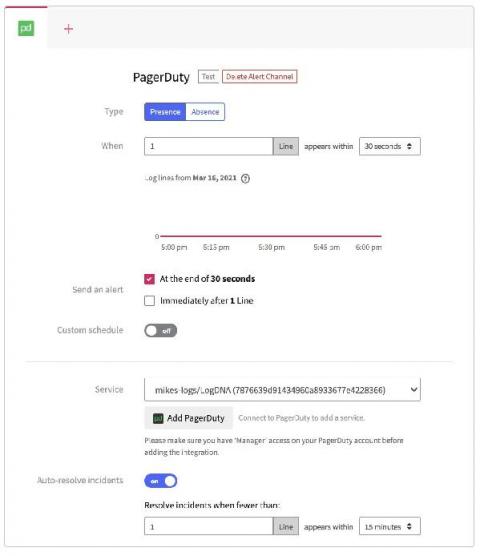
Automate your LogDNA + PagerDuty Incident Workflow
LogDNA integrates with your PagerDuty instance to help trigger incidents based on log data coming in from your ingestion sources. This allows your teams to quickly understand when there are issues with your application, and where in the logs you can investigate to understand root cause. To help further accelerate your team’s ability to understand the state of your applications, we are introducing the ability to automatically resolve those PagerDuty Incidents directly from LogDNA.
Logit.io Ramp Up Channel Efforts With The Launch Of New Global Partner Program
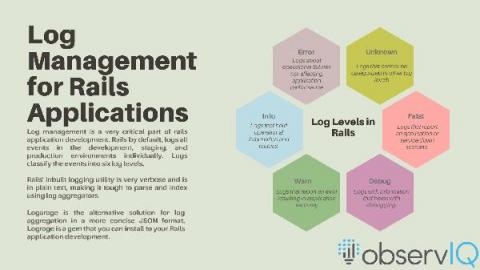
Rails + observIQ; Chapter 1: Log management at the core of Rails application development
Logging is useful in building, managing and debugging Rails applications. Most logging functionalities are built into the application, and it is fairly simple to find the logs. However, as your applications scale up in volume, it becomes difficult to trace the source of an issue. That’s when you want to implement a cloud based log management system to get a unified view of all logs from your Rails application.
Observability and Cyber Resiliency - What Do You Need To Know?
Observability is one of the biggest trends in technology today. The ability to know everything, understand your system, and analyze the performance of disparate components in tandem is something that has been embraced by enterprises and start-ups alike. What additional considerations need to be made when factoring in cyber resiliency? A weekly review of the headlines reveals a slew of news covering data breaches, insider threats, or ransomware.
The Syslog Staying Power
Best practices for collecting and managing serverless logs with Datadog
Logs are an essential part of an effective monitoring strategy, as they provide granular information about activity that occurs anywhere in your system. In serverless environments, however, you have no access to the infrastructure that supports your applications, so you must rely entirely on logs from individual AWS services when troubleshooting performance issues.
5 Minute ChaosSearch Overview
Securing Serverless Applications with Critical Logging
We’ve seen time and again how serverless architecture can benefit your application; graceful scaling, cost efficiency, and a fast production time are just some of the things you think of when talking about serverless. But what about serverless security? What do I need to do to ensure my application is not prone to attacks? One of the many companies that do serverless security, Protego, came up with an analogy I really like.
Logit.io Launch New ELK Stack Dashboard Layout
The Stanza Story
We launched the Stanza log agent just over one year ago. Stanza is the result of an uncompromising stance on performance, processing, and configurability for log telemetry. It took mere days for friends and colleagues in the space to raise the obvious objection – there are already so many logging agents, so why spend time on a *new* one? We also heard from competitors who had a snarkier take…
Cloud-Centric PCI Compliance Demands Cloud-Native Controls
Over the last 15-plus years, the Payment Card Industry Data Security Standard – a.k.a. PCI DSS – has endured as the bellwether of IT security standards. For today’s e-commerce vendors and cloud centric retailers, maintaining alignment with “PCI” remains as relevant as ever, especially given the continued proliferation of threats and diversity of cloud and hybrid environments.
10 Hard Things in Engineering We Don't Spend Enough Time On
Engineering time is a precious resource. We often have to balance many tasks and often conflicting priorities. In this article, we’ll look at ten activities for which allocating more time can be beneficial. Let’s learn from the mistakes of others.
Logit.io Launch New ELK Stack Dashboard Layout
We are pleased to announce our newly launched dashboard design which we have created to assist cross team collaboration for users that prefer to use multiple Stacks per account. We understand that Cybersecurity specialists, Sysadmins, Product owners, developers and CTOs may all have different requirements for using our platform for logs and metrics analysis.
How LogDNA Gives Developers Easy Access To The Information They Need
Developers of any skill set find it frustrating when we don’t have access to the information we need. We want easy and complete access to application logs so that we can troubleshoot application problems. Quickly resolving issues requires a complete picture of what’s going on. Using the wrong tools limits our ability to determine what’s wrong, slowing the repair process.
7 Ways to Make Your Logs More Actionable
Generating and collecting logs is one thing. Generating and collecting actionable logs can be quite another. That's a problem because logs that are not actionable – meaning they can be easily used to derive valuable insights or resolve issues – are not very valuable. If you don't generate actionable logs, you might as well not log at all. Fortunately, ensuring that you generate useful logs is not tricky. Keep reading for seven tips on making your logs actionable and valuable.
How to Organize and Tag Your Logs
Developers must have access to the information that they need. Accessing this information, however, can be time-consuming. With the wrong tools or workflow, it’s frustrating and challenging to filter logs by source. Tags are an easy solution from LogDNA that helps developers get a more granular view of what’s going on in our services.
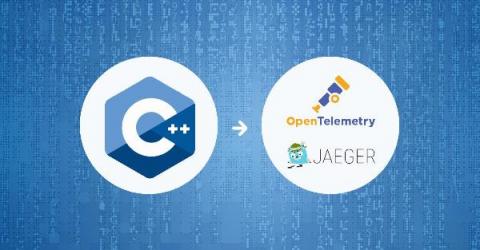
Distributed Tracing for C++ Applications with OpenTelemetry & Logz.io
Many organizations are moving from monolithic to microservices-based architectures. Microservices allow them to improve their agility and provide features more quickly. Although developing a single microservice is simpler, the complexity of the overall system is much greater. Here, we’ll review how to add distributed tracing to C++ with the OpenTelemetry collector and send to Logz.io. One of the biggest challenges is finding efficient tools to quickly debug and solve production problems.
Welcome to Splunk!
How Youredi Used Logit.io To Fulfill Their Client's Dashboard Needs
See how the Logit.io platform helped give Youredi a more streamlined reporting and data visualisation alternative to using Microsoft’s Power BI in our latest customer case study. Outside of its BI capabilities, the Logit.io platform is used throughout Youredi by everyone from their technical teams through to their customer support and professional services department.
Centralized Log Management and APM/Observability for Application Troubleshooting and DevOps Efficiency
Graylog Logview
Adapting to New Federal Regulations on Cybersecurity and Log Management
The Biden administration signed an executive order recently to regulate security practices among federal agencies and establishments. The decision modernizes and improves government networks in pursuit of fool-proof federal cyber defense. This comes in the wake of a series of malicious cyberattacks that targeted both public and private entities in the past year. In the largest breach in US history, SolarWinds
New Google Cloud instance types on Elastic Cloud
We are excited to announce support for Google Compute Engine (GCE) N2 general purpose virtual machine (VM) types, and additional hardware configuration options powered by N2 custom machine types. N2 VMs leverage Intel 2nd Generation Xeon Scalable processors and provide a balance of compute, memory, and storage. N2 machine types also offer more than a 20% improvement in price-performance over the first-generation N1 machines.
Logit.io named as a Performer in log management & data analytics award
We are excited to announce that Logit.io has recently taken home three awards from Appvizer’s selection ranking the best log management and data analytics tools on their platform. In addition to this, we’ve also been named as one of their certified partners for 2021.
Supercharge Storage Optimization Via Graylog
Just how smart is your storage management? Storage is one of the most promising ways to shift from the "more is better" philosophy to the "work smarter" philosophy. What do I mean by that? Historically, IT managers who needed more storage responded in the most obvious way: they bought more. Then they deployed it, integrated it, and waited until the problem recurred.
Elevate your event data with Custom Data Enrichment in Coralogix
Have you ever found yourself late at night combing through a myriad of logs attempting to determine why your cluster went down? Yes, that’s a really stressful job, especially when you think about how much money your company loses as a result of these incidents. Gartner estimates that the revenue lost due to outages is around $5,600/minute, which amounts to more than $330K/hour.
Fast and Powerful Log Investigation for DevOps Teams
Python Logging Levels Explained
Full-cycle observability with the Elastic Stack and Lightrun
An application running in production is a difficult beast to tame. Most experienced developers–ones who spent enough late nights or Saturday mornings trying to break apart a nasty production bug–will try and create the clearest possible picture for their later selves while writing their code, so that they could understand what’s actually going on in the system during an incident.
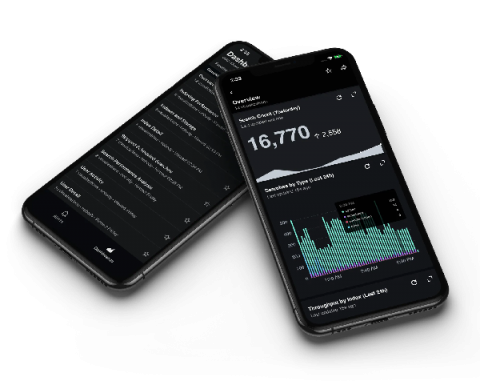
Access the Cloud Monitoring Console from Anywhere
Have you ever wanted to check the status of your Splunk Cloud Platform deployment but can't easily access your laptop? We've got you covered— the Cloud Monitoring Console is now available on Spunk Mobile.
Google Cloud's 23 regions for logging, Private Service Connect & more!
What's New in the Splunk Dataflow Template
The Splunk Dataflow template is an indispensable tool that allows Google Cloud customers to easily engineer a horizontally scalable and fault-tolerant logging export pipeline into Splunk® Enterprise and Splunk Cloud Platform™.
Ship Logs from Docker with the Logz.io Fluentd Proxy
The past year has been significant for continued development of both DevOps practices and new developments across the open source community. To that end, Logz.io is moving forward with renewed support for the Fluentd log shipper. This new proxy will serve as an alternative to Filebeat and Logstash, which recently moved away from open source licensing. Additionally, this integration utilizes an HTTP proxy instead of the SOCKS5 proxy necessary for Filebeat.
New Solutions to New Observability Needs
“Observability,” is the process in DataOps of recording data generated by digital systems as they go about their processes. There are some great companies in the observability space, generating a whopping $17 billion annually, and contributing a significant portion to the modest 2.5 quintillion bytes of data created every year.
Monitor and troubleshoot your VMs in context for faster resolution
Troubleshooting production issues with virtual machines (VMs) can be complex and often requires correlating multiple data points and signals across infrastructure and application metrics, as well as raw logs. When your end users are experiencing latency, downtime, or errors, switching between different tools and UIs to perform a root cause analysis can slow your developers down.
Archiving Logs directly to AWS for Extended Retention | observIQ
The Top 50 ELK Stack & Elasticsearch Interview Questions
If you are a candidate looking for your next role that involves an in-depth knowledge of Elasticsearch and the wider Elastic Stack then you will want to revise beforehand. In this resource guide on the top ELK interview questions, we've listed all of the leading questions that candidates are commonly asked about Elasticsearch, Logstash & Kibana (and their contemporary tools and plugins) alongside the answers. Want to improve your knowledge further?
How to Troubleshoot Apache Cassandra Performance Using Metrics and Logs in Debugging
Tutorial: Set up an NGINX for Kubernetes Sources
30 Second Centralized Logging Agent Installation | observIQ
A guide to deploying Grafana Loki and Grafana Tempo without Kubernetes on AWS Fargate
At Seniorlink, we provide services and technology to support families caring for their loved ones at home. In the past two years we’ve expanded our programs across the United States, and so our need to observe our application systems has grown too.
Product Explainer Video: Splunk Infrastructure Monitoring for Real-time Monitoring in the Cloud
Read active log files more quickly and easily with the new filestream input in Filebeat
With Elastic 7.14, the filestream input, the successor of log input, is now generally available in Filebeat. This new, superior input provides better support for reading active log files, with faster reaction time when there is backpressure in the system, quicker registry updates, better cooperation with external log rotation tools, and more.
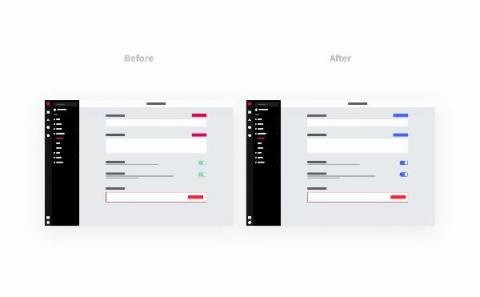
Making the LogDNA UI more accessible
I’m Tim, a Product Design Manager at LogDNA and a massive coffee and magic enthusiast. My team is responsible for creating a beautiful and easy-to-navigate user interface so that you can easily access, and gain value from, your logs. We’ve been working on making our product more accessible and are about to roll out some subtle changes.
Logit.io To Double Down On Their Commitment To Transparent Pricing, No Data Egress Fees & Zero Vendor Lock-In
Empower Your Organization with Splunk On the Go
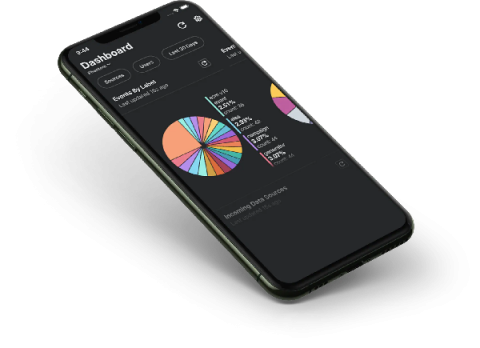
Want to access your Splunk data on the go? We’re making it easier than ever to unlock value from your data anywhere at any time. Regardless of your role or level of technical expertise, you can use Splunk Mobile to view dashboards and take action from your mobile device.
Think you need a data lakehouse?
Drive Successful AI Projects with Graylog
Many IT professionals think of Graylog primarily as a security (SIEM) solution, and of course it can be used in that way to great effect. However, Graylog’s industry-leading log aggregation, search, visualization, and classification capabilities go far beyond that role alone.
Archiving Is In, And Your Logs Are Here To Stay!
Archiving is in and your logs are here to stay! We develop features that streamline the log management processes for our users. Logs are information assets, and we understand that you need to retrieve, re-asses and draw insights from your historic logs. observIQ offers a simple integration with Amazon Web Services (AWS) for extended retention. It takes less than 30 seconds to set up and archive logs directly to an S3 bucket in your AWS account.
Troubleshoot GKE apps faster with monitoring data in Cloud Logging
When you’re troubleshooting an application on Google Kubernetes Engine (GKE), the more context that you have on the issue, the faster you can resolve it. For example, did the pod exceed it’s memory allocation? Was there a permissions error reserving the storage volume? Did a rogue regex in the app pin the CPU? All of these questions require developers and operators to build a lot of troubleshooting context.
Running Telegraf as Serverless on AWS Lambda for Monitoring Your Cloud
Telegraf is one of the coolest open source agents for collecting metrics. It’s part of the TICK Stack (Telegraf, Influx, Chronograf and Kapacitor) and with Telegraf you can collect metrics from a wide array of inputs and write them into a wide array of outputs. It is plugin-driven for both collection and output of data so it is easily extendable.
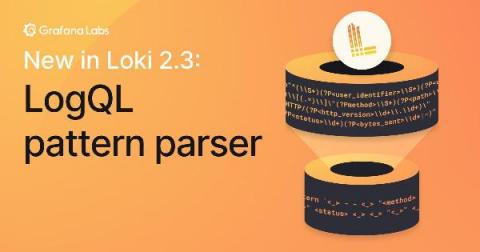
New in Loki 2.3: LogQL pattern parser makes it easier to extract data from unstructured logs
Writing LogQL queries to access Loki’s log data just got easier, thanks to the new pattern parser released with Loki 2.3. It makes writing queries for unstructured log formats simple. And the pattern parser can be an order of magnitude faster than the regular expression parser. Let’s take a closer look.
Use log buckets for data governance, now supported in 23 regions
Logs are an essential part of troubleshooting applications and services. However, ensuring your developers, DevOps, ITOps, and SRE teams have access to the logs they need, while accounting for operational tasks such as scaling up, access control, updates, and keeping your data compliant, can be challenging. To help you offload these operational tasks associated with running your own logging stack, we offer Cloud Logging.
Preparing for the Elastic Certified Observability Engineer Exam - Get Elasticsearch Certified
Loki 2.3 is out: Custom retention, 15x query speed on recent data, Prometheus-style recording rules
Excellent new features have arrived in Loki v2.3.0. Bug fixes too. And performance increases on top of that. While we have been quiet, we have been very busy!
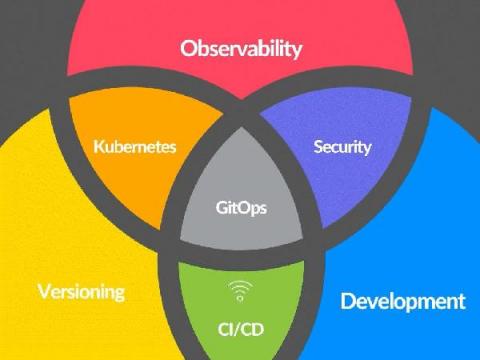
The Evolving World of GitOps and Observability
Is GitOps changing observability as we know it? GitOps has been the buzz word in the DevOps space for several years. GitOps, to those that are not familiar, is an operational methodology for DevOps that leverages a continuous deployment approach with Git as the single source of ‘truth’ for declarative control over both infrastructure and applications.
The Power of Splunk
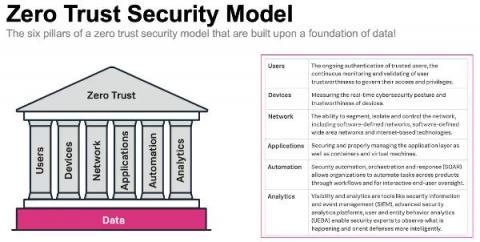
A Zero Trust Security Approach for Government: Increasing Security but also Improving IT Decision Making
Public sector organisations are in the middle of a massive digital transformation. Technology advances like cloud, mobile, microservices and more are transforming the public sector to help them deliver services as efficiently as commercial businesses, meet growing mission-critical demands, and keep up with market expectations and be more agile.
New histogram features in Cloud Logging to troubleshoot faster
Visualizing trends in your logs is critical when troubleshooting an issue with your application. Using the histogram in Logs Explorer, you can quickly visualize log volumes over time to help spot anomalies, detect when errors started and see a breakdown of log volumes. But static visualizations are not as helpful as having more options for customization during your investigations.
What is Splunk Security Analytics for AWS?
Elastic recognized for innovation by Google Cloud and Microsoft
Elastic received honors from two key partners, Microsoft and Google — a recognition of our efforts to ensure that customers can easily find and use Elastic products in the environments that best suit their needs. Elastic was named the 2021 Microsoft US Partner Award Winner in Business Excellence in the Commercial Marketplace. In addition, for the second year in a row, Elastic was selected by Google Cloud as the 2020 Technology Partner of the Year for Data Management.
How to Monitor Redis Logs and Metrics
Elastic Agent and Fleet make it easier to integrate your systems with Elastic
Today, we are happy to announce three major improvements that will make it easier to integrate your systems and applications with the Elastic Stack. First, we are launching the generally available (GA) release of our Elastic Agent, which is a single, unified agent for both observability and security. A unified agent will simplify data onboarding with fewer things to configure and install.
Elastic 7.14.0 introduces the industry's first free and open Limitless XDR
We are pleased to announce the general availability (GA) of Elastic 7.14, including our Elastic Enterprise Search, Observability, and Security solutions, which are built into the Elastic Stack — Elasticsearch and Kibana. Elastic 7.14 empowers organizations with the first free and open Limitless XDR, which delivers unified SIEM and endpoint security capabilities in one platform.
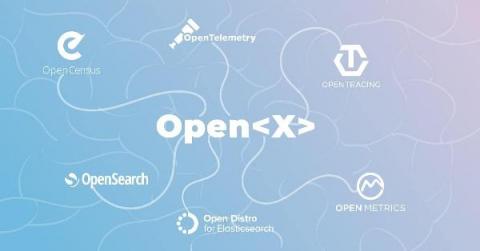
Quick Dictionary to Open<X> Projects in Observability
Do you also find yourself confused by all the Open-this and Open-that names flying around? There are currently a good few Open projects, standards, tools – OpenTelemetry, OpenTracing, OpenCensus, OpenSearch… heck, even my podcast is called OpenObservability! And new Open names seem to be popping up every other day. If you too feel this way, there’s no need. Many feel similarly confused.
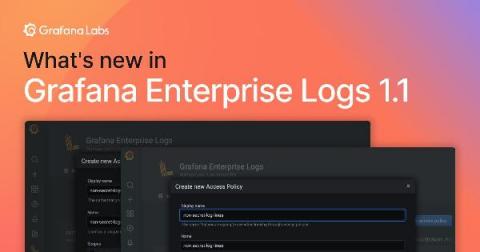
What's new in Grafana Enterprise Logs 1.1: Label-based access control
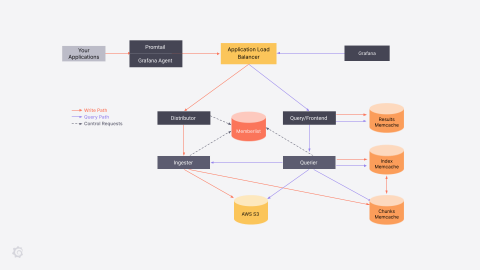
Back in February, we introduced Grafana Enterprise Logs (GEL) into the Grafana Enterprise Stack. GEL is a new way for large organizations to ingest and query their full log volume, without the cost or operational complexity associated with other solutions. (View a demo here.) We just released GEL 1.1, and one of its key features is label-based access control (LBAC).
Logging, Monitoring, and Debugging in Kubernetes
No matter what you’re using Kubernetes for, visibility into your applications’ performance and activity is a beneficial and often essential undertaking – essential, but colossal, requiring entire teams dedicated to nothing but maintaining deployments, auditing, debugging, and keeping up with compliance. Kubernetes has robust support documentation dedicated exclusively to assisting customers with Monitoring, Logging, and Debugging.
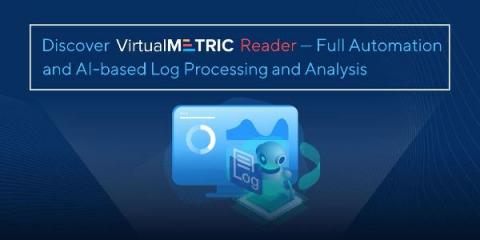
Discover VirtualMetric Reader - Full Automation and AI-based Log Processing and Analysis
VirtualMetric presents a new feature as part of our Log Tracking Suite – VirtualMetric Log Reader. The new capability of the product connects to any device within your IT infrastructure, collects the log information, parses it and transforms it into easy to analyse charts and graphs. No need to add any data sources or to read logs manually.
Logit.io Confirms Plans To Support AWS OpenSearch & OpenDashboards
We are excited to inform all of our users that we will be bringing OpenSearch and OpenDashboards onto the Logit.io platform in the coming months. You may have already been aware that we’ve previously announced our support for the previous iteration of OpenSearch & OpenDashboards known as Open Distro in our response here. Due to our early public support of these oncoming changes you can see our platform cited on the official AWS OpenSearch website.


