Operations | Monitoring | ITSM | DevOps | Cloud
September 2021
Log Observability and Log Analytics
Logs play a key role in understanding your system’s performance and health. Good logging practice is also vital to power an observability platform across your system. Monitoring, in general, involves the collection and analysis of logs and other system metrics. Log analysis involves deriving insights from logs, which then feeds into observability. Observability, as we’ve said before, is really the gold standard for knowing everything about your system.
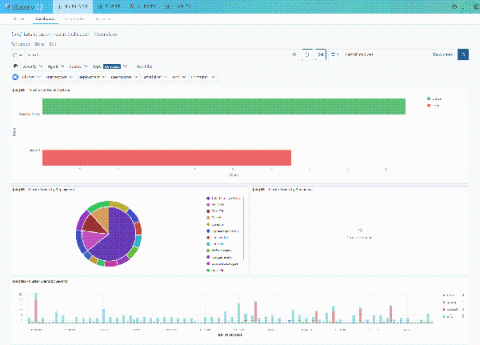
Getting to know Kibana
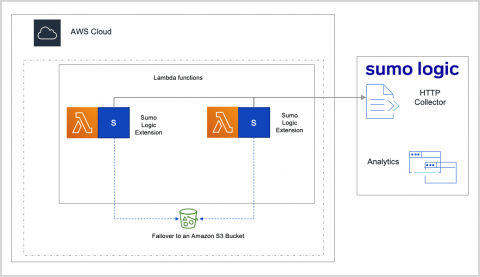
Sumo Logic Extends Monitoring for AWS Lambda Functions Powered by AWS Graviton2 Processors
How Splunk IT Service Intelligence Assures Business Service Performance for Financial Institutions
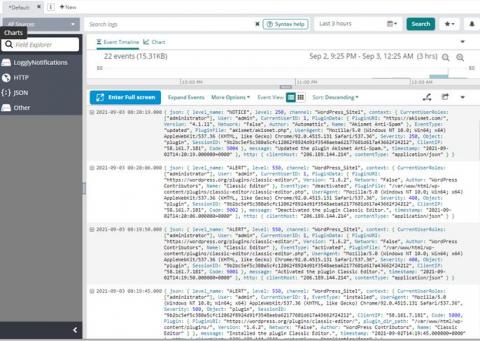
Boss-Level Log Management for WordPress Site Administrators
Logit.io Announces The Beta Launch Of Hosted Grafana
We are pleased to announce the beta launch of hosted Grafana in addition to our existing ELK as a Service & hosted Open Distro services. As organisations around the world are constantly looking for ways that they can ensure compliance is being upheld, speeding up Mean Time To Repair (MTTR) and reducing the risk of DDoS attacks, managed Grafana forms a vital role in improving metrics observability across the entirety of your infrastructure.
Apache Kafka Tutorial: Use Cases and Challenges of Logging at Scale
Enterprises often have several servers, firewalls, databases, mobile devices, API endpoints, and other infrastructure that powers their IT. Because of this, organizations must provide resources to manage logged events across the environment. Logging is a factor in detecting and blocking cyber-attacks, and organizations use log data for auditing during an investigation after an incident. Brokers, such as Apache Kafka, will ingest logging data in real-time, process, store, and route data.
Headless WordPress With Real-Time Logging by Papertrail
Ingest data directly from Google Pub/Sub into Elastic using Google Dataflow
Today we’re excited to announce the latest development in our ongoing partnership with Google Cloud. Now developers, site reliability engineers (SREs), and security analysts can ingest data from Google Pub/Sub to the Elastic Stack with just a few clicks in the Google Cloud Console. By leveraging Google Dataflow templates, Elastic makes it easy to stream events and logs from Google Cloud services like Google Cloud Audit, VPC Flow, or firewall into the Elastic Stack.
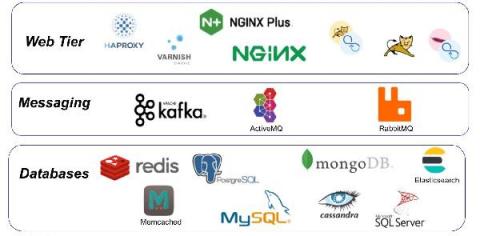
Extending Observability to App Infrastructure
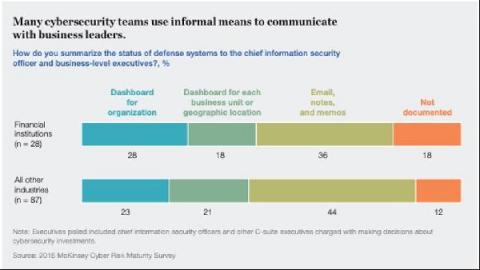
5 priorities for CISOs to regain much needed balance in 2022
Here’s what security leaders need to do in the face of rising stress levels and cyberattacks Nearly 9 out of 10 CISOs say their existing systems secured their enterprise through a shift to remote work, an ongoing labor shortage, and a huge spike in cybersecurity attacks. But that success came with a price: 64% say they’re more stressed out than they were a year ago. How can CISOs navigate a new set of challenges in 2022, while also regaining some much needed balance?
What are AWS Log Insights and How You Can Use Them
Within this blog post, we’re going to take a look at AWS Log Insights and cover some of the topics that you will find useful around what it is, how to use it, and how it can link in with our various solutions.
Introducing Pre-Installed Logz.io Metrics Dashboard Bundles
We are proud to announce the launch of direct dashboard uploads with Logz.io. These new metrics dashboard templates are available for 25 different tools and more to come. Each of these templates is now available to Logz.io customers and covers the gamut of popular monitoring tools used by DevOps teams. Some of these tools also include multiple options. The process is simple. Head into the Logz.io app and head to your metrics account.
We Will All Be Remembered Forever - And There's Nothing You Can Do About It
I want to be remembered. I think a lot of us do. At least, that’s what I used to think. Now I am not so sure. I have a bad habit of looking at the universe through an existential lens where value is measured by impact. Impact, meaning the measurable change created by specific action. Since everything physical ultimately decays, the longest lasting impacts are those that linger in our collective memory. Great works, great triumphs, great discoveries, and great inventions – great impacts.
Micro Lesson: Setting up an Outlier-based Monitor
Microlesson: Using Alert Response
Micro Lesson: Cross Tier Search
Micro Lesson: Span Analytics
Micro Lesson: Introduction to Observability Solution
Tour of the Graylog Community
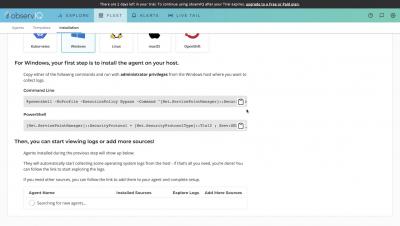
30 Second Windows VM Log Monitoring | observIQ
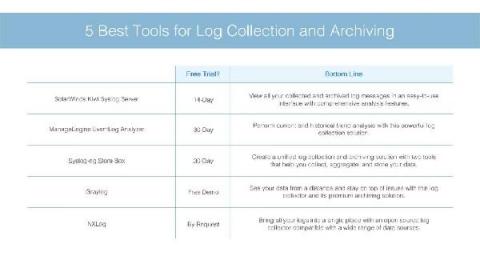
5 Best Tools for Log Collection and Archiving With Guide
How the French Ministry of Agriculture deploys Elastic to monitor the commercial fishing industry
Within the French Ministry of Agriculture and Food (the Ministry), our team of architects in the Methods, Support and Quality office (BMSQ) evaluate and supply software solutions to resolve issues encountered by project teams that affect various disciplines. As data specialists, one area we’ve been involved in includes reconfiguring the traceability of activities for the commercial fishing industry.
Security Analytics is a Team Sport
Defending against security threats is a full-time job. The question is: Whose job is it? Our cybersecurity landscape is in constant flux, with more users having increased access to corporate data, assets, APIs, and other entry points into the organization.
Why LogDNA Received the EMA Top 3 Award for Observability Platforms
We’re honored to be included in Enterprise Management Associates’ EMA Top 3 Award for Observability Platforms. This award recognizes software products that help enterprises reach their digital transformation goals by optimizing product quality, time to market, cost, and ability to innovate—all the things we’re passionate about at LogDNA.
Logging USB Storage with Graylog
Unexpected Parallels Between Yoga and Observability
Yoga is to ideal human health what observability is to an application’s ideal functioning. It is well established that observability is a critical factor for the successful implementation and maintenance of cloud-native, serverless, cloud-agnostic, and microservices-based applications. Well-established observability helps DevOps and development teams cross the boundaries of complex systems and get complete visibility into their functioning.
Tutorial: Setting up AWS CloudWatch Alarms
AWS CloudWatch is a service that allows you to monitor and manage deployed applications and resources within your AWS account and region. It contains tools that help you process and use logs from various AWS services to understand, troubleshoot, and optimize deployed services. I’m going to show you how to get an email when your Lambda logs over a certain number of events.
Telegraf Integrations with Logz.io
Logz.io is proud to announce a slew of new integrations via Telegraf. Logz.io utilizes Prometheus in its product, but aims to support compatibility across common DevOps tools. A number of our customers, and the community in general, are strong users of Telegraf and its companion apps in the TICK Stack (which includes InfluxDB). Telegraf is not as popular as Prometheus, but it’s a strong element in the DevOps toolbox.
Tutorial: Set up an AWS CloudTrail Source
Grey's Academy 301: Intel (OpenVino)
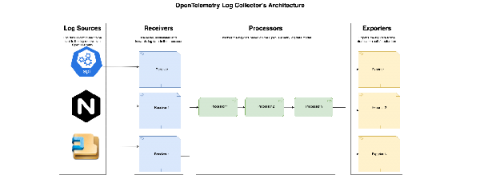
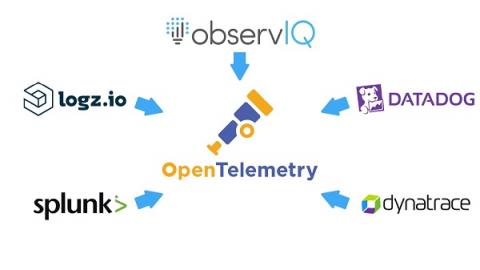
observIQ Cloud and the OpenTelemetry Collector
Our log agent is powerful, efficient, and highly adaptable. Now, with OpenTelemetry setting new standards in the observability space, we wanted to incorporate that collaboration into our log agent and offer our users the ability to take advantage of the OpenTelemetry ecosystem. Starting today, you can upgrade the log agents in your observIQ account to the new Open Telemetry-based observIQ log agent with a single click.
ChaosSearch Named "Most Likely to be the Next Boston Unicorn" in Startup Boston's Community Awards
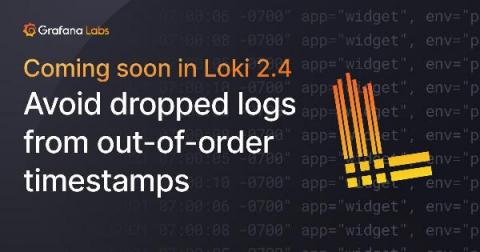
Avoid dropped logs due to out-of-order timestamps with a new Loki feature
Dropped log lines due to out-of-order timestamps can be a thing of the past! Allowing out-of-order writes has been one of the most-requested features for Loki, and we’re happy to announce that in the upcoming v2.4 release, the requirement to have log lines arrive in order by timestamp will be lifted. Simple configuration will allow out-of-order writes for Loki v2.4.
Volume, velocity, variety, and variability - Arijit Mukherji on Splunk Observability Cloud
Scale for fully automated Kubernetes monitoring in minutes
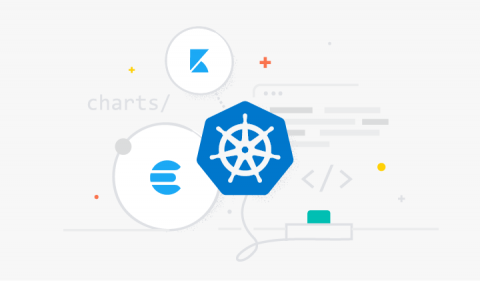
A simplified stack monitoring experience in Elastic Cloud on Kubernetes
To monitor your Elastic Stack with Elastic Cloud on Kubernetes (ECK), you can deploy Metricbeat and Filebeat to collect metrics and logs and send them to the monitoring cluster, as mentioned in this blog. However, this requires understanding and managing the complexity of Beats configuration and Kubernetes role-based access control (RBAC). Now, in ECK 1.7, the Elasticsearch and Kibana resources have been enhanced to let us specify a reference to a monitoring cluster.
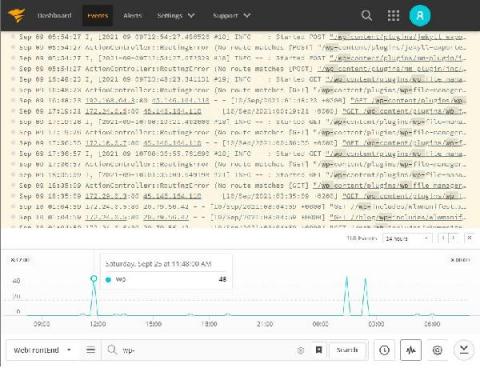
How to Log to Console in PHP and Why Should You Do It
Monitoring, troubleshooting, and debugging your code all require logging. It not only makes the underlying execution of your project more visible and understandable, but it also makes the approach more approachable. Intelligent logging procedures can assist everyone in a company or community to stay on the same page about the project's status and progress.
Setting up a syslog source in 30 seconds | observIQ
Add and manage users | observIQ
What's new in Elastic Maps: Maps tailored to your geospatial data
Sysadmins, cartographers, and dashboard designers can now personalize Elastic Maps to create richer geodata stories. The 7.14 release of Elastic Maps has the geo capabilities to highlight points of interest, hide unnecessary details, and help you explore new trends in your data. Elastic Maps is available now on Elastic Cloud — the only hosted Elasticsearch offering to include all of its latest features.
Security Hygiene - Why Is It Important?
“What happened?” If you’ve never uttered those words, this blog isn’t for you. For those of us in cybersecurity, this pint-sized phrase triggers memories of unforeseen security incidents and long email threads with the CISO. What happened to those security patches? Why didn’t we prevent that intrusion? Organizations tend to lean towards protecting their borders and less towards understanding the importance of overall security hygiene.
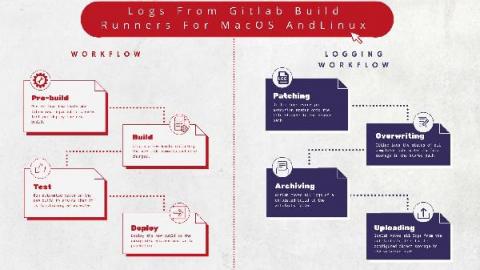
Logging Gitlab Runners for MacOS and Linux
Gitlab is the DevOps lifecycle tool of choice for most application developers. It was developed to offer continuous integration and deployment pipeline features on an open-source licensing model. GitLab Runner is an open-source application that is integrated within the GitLab CI/ CD pipeline to automate running jobs in the pipeline. It is written in GoLang, making it platform agnostic. It is installed onto any supported operating system, a locally hosted application environment, or within a container.
Auto-Instrumenting Ruby Apps with OpenTelemetry
In this tutorial, we will go through a working example of a Ruby application auto-instrumented with OpenTelemetry. To keep things simple, we will create a basic “Hello World” application, instrument it with OpenTelemetry’s Ruby client library to generate trace data and send it to an OpenTelemetry Collector. The Collector will then export the trace data to an external distributed tracing analytics tool of our choice.
Logz.io's New Lookz is Generally Available!
Back in June, we announced the Public Beta for Logz.io’s New Lookz – which is a new UI that completely changes the way users navigate across Logz.io products and features. The Public Beta gave users the option to toggle between the old and new UIs to see which one they liked better. And the answer from our users was as clear as it could be.
How to ingest data with PHP Client into App Search
Workload Pricing and SVCs: What You Can See and Control
The Cloud Monitoring Console (CMC) lets Splunk Cloud Platform administrators view information about the status of a Splunk Cloud Platform deployment. For workload pricing, the CMC lets you monitor usage and stay within your subscription entitlement. From the CMC you can see both ingest and SVC usage information and can gain insight into how your Splunk Cloud Platform deployment is performing.
What is Splunk Virtual Compute (SVC)?
A Splunk Virtual Compute (SVC) unit is a powerful component of our workload pricing model. Historically, we priced purely on the amount of data sent into Splunk, leading some customers to limit data ingestion to avoid expense related to high volumes of data with low requirements on reporting. With Splunk workload pricing, you now have ultimate flexibility and control over your data and cost.
Logz.io Extends Alert Communications via Microsoft Teams Integration
If you’re a DevOps practitioner working in a Microsoft-centric environment, you’ll be pleased to learn that Logz.io recently added support for the popular Teams communications hub to help broadcast pressing alerts and other monitoring data. The integration comes on the heels of making the Logz.io platform directly available from within the Azure Console and expands organizations’ abilities to communicate and share notifications about everything from log data to security events.
Using Cribl LogStream to Ingest OctoPrint Logs in OpenSearch
Product Explainer Video Short: Splunk Infrastructure Monitoring for Real-time Cloud Monitoring
observIQ Releases First PnP Solution for monitoring arm-based Kubernetes
Arm-based Kubernetes clusters have been in use for a while, albeit mostly for niche uses, by enthusiasts, and DIY hobbyists. But that is changing. Arm architecture offers an efficiency and scalability that other architectures do not, and that makes it appealing to businesses.
Mark Rows in UI
Secure your deployments on Elastic Cloud with Google Cloud Private Service Connect
We are pleased to announce the general availability of the Google Cloud Private Service Connect integration with Elastic Cloud. Elastic Cloud VPC connectivity is now available to all customers across all subscription tiers and cloud providers (AWS, Microsoft Azure, and Google Cloud).
All You Need To Know About HAProxy Log Format
Data Lakes Are Gaining Maturity, According to 2021 Gartner Hype Cycle for Data Management
Maintaining reliable services with advanced Cloud Logging features
Monitoring Physical Security With Graylog final
The Observability Data Opportunity
Observability data, and especially log data, is immensely valuable for modern business. Making the right decision—from monitoring the bits and bytes of application code to the actions in the security incident response center—requires the right people to generate insights from data as fast as possible.
Nginx Logs in 30 Seconds | observIQ
OpenTelemetry - Defining Observability Industry Standards
Plenty of blogs have answered the very Google-able question, “What is OpenTelemetry?” To keep it short and sweet, OpenTelemetry is a collaborative effort across the observability space to create industry-wide standards that will benefit all cloud service providers and observability customers. Technically speaking, OpenTelemetry is a collection of APIs, SDKs, exporters, and collectors.
With Elastic Cloud on AWS, Smarter City Solutions ensures seamless customer experience across the Smarter Parking Platform
Ensuring a seamless customer experience is a growing challenge for digital technology providers. Yet, as functionality and a customer base scale, predictability can become challenging.
Understanding Cardinality in a Monitoring System and Why It's Important
The journey to becoming cloud-native comes with great benefits but also brings challenges. One of these challenges is the volume of operational data from cloud-native deployments — data comes from the cloud infrastructure, ephemeral application components, user activity, and more. The increased number of data sources does not only increase datapoint volume – it also requires that monitoring systems store and query against data with higher cardinality than ever before.
Taming Rails Logging with Lograge and LogDNA
Rails is a classic on Ruby for a reason. The framework is powerful, intuitive and the language has a low entry bar. However, being designed when systems existed on a single server, standard Rails logging is excessively fractionalized. Even on a single server, a straightforward call can quickly turn into seven unique, unconnected logs.
Elasticsearch Audit Logs and Analysis
Security is a top-of-mind topic for software companies, especially those that have experienced security breaches. Companies must secure data to avoid nefarious attacks and meet standards such as HIPAA and GDPR. Audit logs record the actions of all agents against your Elasticsearch resources. Companies can use audit logs to track activity throughout their platform to ensure usage is valid and log when events are blocked.
9 Best Practices for Application Logging that You Must Know
Have you ever glanced at your logs and wondered why they don't make sense? Perhaps you've misused your log levels, and now every log is labelled "Error." Alternatively, your logs may fail to provide clear information about what went wrong, or they may divulge valuable data that hackers may exploit. It is possible to resolve these issues!!!
Assign Read-Only Access to Users in Logz.io
Cloud monitoring and observability can involve all kinds of stakeholders. From DevOps engineers, to site reliability engineers, to Software Engineers, there are many reasons today’s technical roles would want to see exactly what is happening in production, and why specific events are happening. However, does that mean you’d want everyone in the company to access all of the data?
Logging Agents Vs Log Libraries
Log management has been around for a long time, but how we manage our logs has changed profoundly over the years. For effective log management, there are times when you may have to trade off the new for the old, and vice versa. A clear understanding of log agents and log libraries will help assess what works best for different applications and infrastructures.
HTTP JSON Web API Input - COVID Dashboard
Best Practices for Logging in Node.js
Good logging practices are crucial for monitoring and troubleshooting your Node.js servers. They help you track errors in the application, discover performance optimization opportunities, and carry out different kinds of analysis on the system (such as in the case of outages or security issues) to make critical product decisions. Even though logging is an essential aspect of building robust web applications, it’s often ignored or glossed over in discussions about development best practices.
Shortcut to Value With Loggly
Modern Security Monitoring Demands an Integrated Strategy
The ultimate success of any security monitoring platform depends largely on two fundamental requirements – its ability to accurately and efficiently surface threats and its level of integration with adjacent systems. In the world of SIEM, this is perhaps more relevant than any other element of contemporary IT security infrastructure.
Cost of ELK
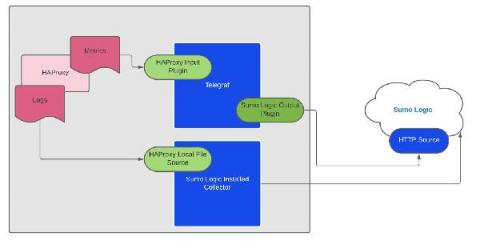
Monitoring HAProxy Logs and Metrics with Sumo Logic
How to Handle Exceptions in Java: Complete Tutorial with Examples and Best Practices
As developers, we would like our users to interact with applications that run smoothly and without issues. We want the libraries that we create to be widely adopted and successful. All of that will not happen without the code that handles errors. Java exception handling is often a significant part of the application code. You might use conditionals to handle cases where you expect a certain state and want to avoid erroneous execution – for example, division by zero.


