Operations | Monitoring | ITSM | DevOps | Cloud
March 2022
AWS vs GCP: Top Cloud Services Logs to Watch and Why
Taming the Complexity of Windows Event Collection with Cribl Stream 3.4
OK, first things first. I have to admit that I am, first and foremost, an old-school UNIX systems administrator. I’m that grizzled sysadmin in your shop who soliloquizes wistfully about managing UUCP for email “back in the day.” Centralizing Logs? Yeah, we had syslog, and saved it all off to compressed files.
Building Your Security Analytics Use Cases
It’s time again for another meeting with senior leadership. You know that they will ask you the hard questions, like “how do you know that your detection and response times are ‘good enough’?” You think you’re doing a good job securing the organization. You haven’t had a security incident yet. At the same time, you also know that you have no way to prove your approach to security is working. You’re reading your threat intelligence feeds.
How to sign up for Elastic Cloud on the AWS Marketplace
Interview With CTO, Sabir Tapory
In the latest instalment of our interviews speaking to leaders throughout the world of tech, we’ve welcomed Sabir Tapory, CTO of ZeeTim. Zeetim is a Maryland-based software development firm that offers to manage cloud endpoints, virtualization, cloud printing, and multi-factor authentication for businesses.
Reporting Up: Recommendations for Log Analysis
What kind of log information should be reported up the chain? At a certain point during log examination analysts start to ask, “What information is important enough to share with my supervisor?” This post covers useful categories of information to monitor and report that indicate potential security issues. And remember: reporting up doesn’t mean going directly to senior management. Most issues can be reported directly to an immediate supervisor.
What is SecOps?
SecOps is a short form for Security Operations, a methodology that aims to automate crucial security tasks, with the goal of developing more secure applications. The purpose of SecOps is to minimize security risks during the development process and daily activities. Under a joint SecOps strategy, the security and operations teams work together to maintain a safe environment by identifying and resolving vulnerabilities and resolving any security issues.
How to Run Java Inside Docker: Best Practices for Building Containerized Web Applications [Tutorial]
Containers are no longer a thing of the future – they are all around us. Companies use them to run everything – from the simplest scripts to large applications. You create a container and run the same thing locally, in the test environment, in QA, and finally in production. A stateless box built with minimal requirements and unlike virtual machines – without the need of virtualizing the whole operating system.
Add severity levels to your alert policies in Cloud Monitoring
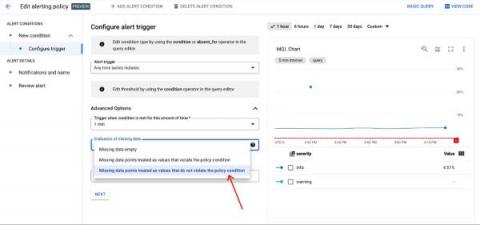
When you are dealing with a situation that fires a bevy of alerts, do you instinctively know which alerts are the most pressing? Severity levels are an important concept in alerting to aid you and your team in properly assessing which notifications should be prioritized. You can use these levels to focus on the issues deemed most critical for your operations and triage through the noise.
Cribl Edge: Nobody Puts Data in the Corner
Has this ever happened to you: ‘I have too many agents to help me collect data for processing into separate SIEMs. It’s a pain to make any changes to their configuration!’ Or perhaps this one: ‘I have a large kubernetes deployment, but I just can’t seem to get metrics and logs out of it and into my SIEM or TSDB!’ Fear not, weary administrators, Cribl Edge is here!
Splunk Indexer Vulnerability: What You Need to Know
A new vulnerability, CVE-2021-342 has been discovered in the Splunk indexer component, which is a commonly utilized part of the Splunk Enterprise suite. We’re going to explain the affected components, the severity of the vulnerability, mitigations you can put in place, and long-term considerations you may wish to make when using Splunk.
The Leading Open Source Metrics Management Tools
If you know anything about upholding the three pillars of observability for your business then you will know that centrally analysing and managing logs, metrics and traces is vital for improving how you observe the status of your business’s key infrastructure components.
Webinar Recap: Launching Cribl Edge
Last week, Cribl launched the latest component of its observability architecture: Cribl Edge. ICYMI, Cribl Edge is a next generation observability data collector that greatly simplifies gathering your metrics, events, and logs. Edge incorporates all of the capabilities of Cribl Stream’s workers, allowing you to route, redact, filter, and enrich data directly from the source. Why is this important?
Celebrate We Will!! Cribl Turns 5 With 300 Employees!!
Today, Cribl is celebrating two significant milestones that are incredibly special to our founders and the entire company. Yesterday, Cribl celebrated its fifth anniversary, a day also shared with Clint’s son’s birthday. While we’re sure there was much celebrating (and cake!), it really earmarked the day our founders decided that building innovative software to help solve technology professionals’ most pressing problems was only going to happen if they were driving it.
HOWTO: Connecting Kafka to Grafana Loki
Is the Cloud an Experience or a Destination?
In a recent episode of the Cloud Happens podcast, Archana Venkatraman, Associate Research Director in Cloud Data Management at IDC Europe talks about how the cloud isn’t a destination. It’s a continuum; a journey. In this blog, we explore that idea a bit more and dive into what really encapsulates a cloud experience. How can modern enterprises benefit from their cloud journey to solve the most gnarly data challenges to unlock innovation, enhance security, and drive resilience.
API & HTTP Headers: How to Use Request Headers in API Checks
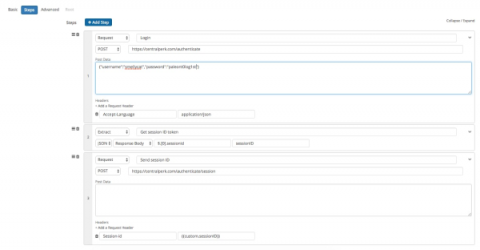
In previous posts we covered why it’s important to monitor APIs and how to monitor and validate data from APIs. In this post we’ll focus on a simple but key feature that helps Splunk Synthetic Monitoring users create robust checks for availability, response time, and multi-step processes: Request Headers
AWS Centralized Logging Guide
The key challenge with modern visibility on clouds like AWS is that data originates from various sources across every layer of the application stack, is varied in format, frequency, and importance and all of it needs to be monitored in real-time by the appropriate roles in an organization. An AWS centralized logging solution, therefore, becomes essential when scaling a product and organization.
Grok Pattern Examples for Log Parsing
Searching and visualizing logs is next to impossible without log parsing, an underappreciated skill loggers need to read their data. Parsing structures your incoming (unstructured) logs so that there are clear fields and values that the user can search against during investigations, or when setting up dashboards. The most popular log parsing language is Grok. You can use Grok plugins to parse log data in all kinds of log management and analysis tools, including the ELK Stack and Logz.io.
The Best Open Source Logging Tools
Users of open-source log collectors and log monitoring solutions often preferred these solutions due to them being well suited for speed, flexibility and their ability to attract talented contributors who are willing to invest time to maintain technology projects they are passionate about. In this post, we’ll look at some of the best free and open-source logging tools out there today.
G2 awards Sematext as high performer in Spring 2022 Reports
At Sematext, we are dedicated to making troubleshooting easier for ops teams. When we started to receive positive reviews from our customers around the globe, we knew we were doing something right. Even as our userbase grew across multiple industries, we continued to get positive feedback. We even received a few awards along the way. In this post, we’re delighted to announce that Sematext Cloud is featured in the G2 Spring 2022 Reports under Monitoring Software Solutions category as.
CIS Control Compliance and Centralized Log Management
Your senior leadership started stressing out about data breaches. It’s not that they haven’t worried before, but they’ve also started looking at the rising tide of data breach awareness. Specifically, they’re starting to see more new security and privacy laws passed at the state and federal levels. Now, you’ve been tasked with the very unenviable job of choosing a compliance framework, and you’re looking at the Center for Internet Security (CIS) Controls.
Building An Agent From First Principles
Yesterday, we officially announced Cribl Edge, a next-generation observability agent. You can find more about its features here. In this post, I am going to walk you through the journey of incepting and building this new product. Our most important core value at Cribl is “Customers First, Always.” and that involves actively listening and being on the lookout for any pains our customers might be experiencing.
DevOps State of Mind Ep. 9: Recruiting for a DevOps Culture
Liesse Jones: Today we're joined by Anna-Marie Gutierrez-Lee, affectionately known as AMG, who's the Director of Talent Acquisition at LogDNA. She's passionate about mentoring recruiting teams and connecting talent to their dream careers, while fostering a genuine and positive candidate experience. Today, we're going to talk about how to recruit for a DevOps culture and why it's so important to bring more underrepresented talent into tech.
How to collect metrics and logs for NGINX using the OpsAgent
The Ops agent is Google’s recommended agent for collating your application’s telemetry data, and forwarding them to GCP for visualization, alerting and monitoring. The Ops agent collates logs and a metrics collector into one single powerhouse. Some of the key advantages of using the Ops agent are outlined below.
Partner Amplification - Logz.io Achieves AWS Security Competency
We’ve got some outstanding news to share in the arena of security partnerships: Logz.io® Cloud-based SIEM has officially achieved Amazon Web Services (AWS) Security Competency! This designation within the Logging, Monitoring, SIEM, Threat Detection, and Analytics category further demonstrates Logz.io’s proven commitment to delivering best-in-class security.
How to tell if you were attacked in the recent Okta security breach
Today, Okta, a leading enterprise identity and access management firm, reported that it had launched an inquiry after the LAPSUS$ hacking group posted screenshots on Telegram.
Upgrade your Splunk instance to jQuery 3.5 in three simple steps
Introducing Cribl Edge
Introducing Cribl Stream
Centralized Log Management and NIST Cybersecurity Framework
It was just another day in paradise. Well, it was as close to paradise as working in IT can be. Then, your boss read about another data breach and started asking questions about how well you’re managing security. Unfortunately, while you know you’re doing the day-to-day work, your documentation has fallen by the wayside. As much as people are loathed to admit it, this is where compliance can help.
More Choice, Less Compromise: We're Taking You to the Edge!
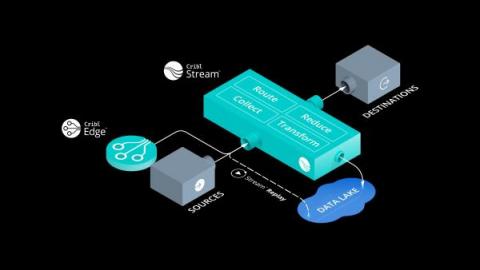
It’s been a busy Winter at Cribl! Today we are officially announcing Cribl Edge, a next-generation agent that expands the scope of observability. In Edge, we’ve taken the very concept of “agent” and given it a Cribl power-up by taking our best-in-class observability pipeline technology built into Cribl Stream and moving it all the way out to edge systems.
Announcing Cribl Edge & Cribl Stream
In 2022, administrators are still managing agents which collect data for observability and security the same way they did 15 years ago: typing in configuration files by hand. A lot has changed since 2006 when Amazon announced AWS. Instead of racking and stacking servers in data centers, we’re spinning up compute resources in a variety of forms – at the click of a button, or automatically through APIs.
Customers First, Always: Thanks for Making the Best Even Better
We’ve come a long way in a short time and that is thanks to you, our customers. Cribl set out to listen to our customers and use that to guide us forward. Today we’re announcing Cribl Edge, a next generation agent designed to to scale your most precious commodity; you. We’re also announcing a name change to the product formally known as LogStream. Now, as with all our releases, it doesn’t stop there. We have some upgrades that all go towards allowing you to scale.
AWS Centralized Logging Guide
How to Get Started with Heroku Logging
Heroku is a platform for deploying, running, and managing applications, which is written in a variety of programming languages, including Python, Java, C#, JavaScript, PHP, and others. Heroku's goal is to free you up to focus on your applications rather than infrastructure management. Logging is usually included in infrastructure management. Heroku provides a high-level log maintenance tool. In this Heroku logging article, we'll learn how to get the most out of Heroku logs.
SRE Metrics: Four Golden Signals of Monitoring
SRE (site reliability engineering) is a discipline used by software engineering and IT teams to proactively build and maintain more reliable services. SRE is a functional way to apply software development solutions to IT operations problems. From IT monitoring to software delivery to incident response – site reliability engineers are focused on building and monitoring anything in production that improves service resiliency without harming development speed.
The Cost of Doing the ELK Stack on Your Own
So, you’ve decided to go with ELK to centralize, manage, and analyze your logs. Wise decision. The ELK Stack is now the world’s most popular log management platform, with millions of downloads per month. The platform’s open source foundation, scalability, speed, and high availability, as well as the huge and ever-growing community of users, are all excellent reasons for this decision.
3 Metrics to Monitor When Using Elastic Load Balancing
One of the benefits of deploying software on the cloud is allocating a variable amount of resources to your platform as needed. To do this, your platform must be built in a scalable way. The platform must be able to detect when more resources are required and assign them. One method of doing this is the Elastic Load Balancer provided by AWS. Elastic load balancing will distribute traffic in your platform to multiple, healthy targets. It can automatically scale according to changes in your traffic.
Micro Lesson: Reliability Management as Code: Using OpenSLO to specify Service Level Objectives
A Monitoring Reality Check: More of the Same Won't Work
On December 7, 2021, Amazon’s cloud services recently suffered a major outage that not only affected Amazon services, but also many third-party services we use day-to-day, including Netflix, Disney+, Amazon Alexa, Amazon deliveries and Amazon Ring. Causes for the outage, which began at 7:30 am PST and lasted nearly seven hours, were detailed in a Root Cause Analysis report published by AWS that shed light on factors that may have contributed to the extended length of the disruption.
Splunk Beyond Logs: Getting to Observability
Those of us of a certain age know well the saying “Nobody got fired for buying IBM.” In the log analysis and security world, we’ve become lucky to get to the point where people are saying “Nobody gets fired for buying Splunk.” Our success in these areas has definitely created a perception for what products Splunk has and what we can offer to our customers. The problem is that most of these perceptions don’t capture the full power of Splunk.
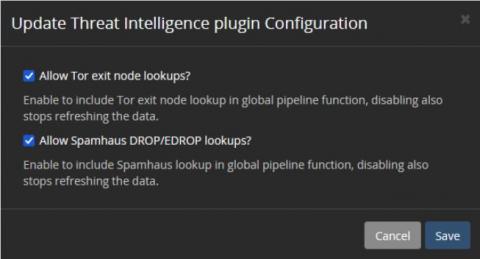
A Beginner's Guide to Integrating Threat Intelligence
Many companies are looking to find a source of threat intelligence that can give them better visibility into the risks unique to their technology stack. While some may not be using threat intelligence, others may not be getting the value they could. Choosing and integrating threat intelligence sources into your cybersecurity monitoring is challenging, but you do need to keep some considerations in mind during the process.
We're Making Our Debut In Cybersecurity with Snowbit
2021 was a crazy year, to say the least, not only did we welcome our 2,000th customer, we announced our Series B AND Series C funding rounds, and on top of that, we launched Streamaⓒ – our in-stream data analytics pipeline. But this year, we’re going to top that! We’re eager to share that we are venturing into cybersecurity!
How To Get Buy In To Support Your Observability Efforts
We’re well into 2022, and it’s full steam ahead addressing challenges and moving IT and SRE projects to completion. Are you ready for the challenges ahead of you? Do you feel prepared to handle the work you know about…and the work that’s sure to come your way? Are you ready for the end-of-the-year budget planning process that will be here before you know it? To help, I’d like to share my learnings from 20+ years in IT.
Sumo Logic all-in with AWS
The Importance of Log Management and Cybersecurity
Struggling with the evolving cybersecurity threat landscape often means feeling one step behind cybercriminals. Interconnected cloud ecosystems expand your digital footprint, increasing the attack surface. More users, data, and devices connected to your networks mean more monitoring for cyber attacks. Detecting suspicious activity before or during the forensic investigation is how centralized log management supports cybersecurity.
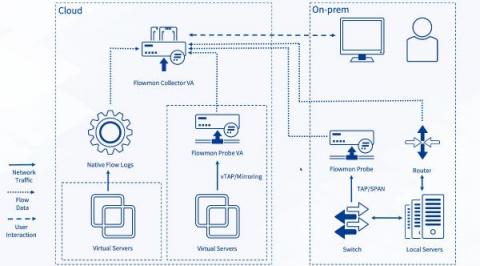
How to Optimize Cloud Monitoring Costs Using Flow Logs in Progress Flowmon
This blog post discusses some of the best practices for balancing the costs of cloud traffic monitoring while maintaining a reasonable level of visibility. Progress Flowmon 12 has introduced the processing of native flow logs from Google Cloud and Microsoft Azure, plus it has enhanced support for Amazon Web Services (AWS) flow logs.
How We Monitor Elasticsearch With Metrics and Logs
Analyzing ESG Survey: Observability from Code to Cloud
Big Data Platform (BDP) Replacement Through Splunk: https://conf.splunk.com/watch/conf-online.html
## Follow Cribl
Introducing New Storage Dashboards in the Cloud Monitoring Console (CMC)
Monitoring and gaining additional insights about usage of your Splunk Cloud Platform deployment is essential for effective management as a Splunk admin. Your Splunk Cloud comes with the Cloud Monitoring Console (CMC) app, which displays relevant information about the status of your Splunk Cloud environment using pre-built dashboards.
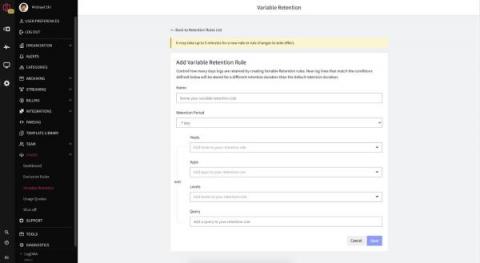
What Is Log Retention?
SaaS Observability Done Right
SaaS (software as a service) is the common model for many businesses today. Even longstanding behemoths such as Cisco and Microsoft have been strategically shifting their software products to SaaS and recurring revenue models (just think Office365 shift from licensed Office). These SaaS businesses need agility to move fast and remain competitive. This means agility in the IT stack, but also agility in the business models to support bottom-up GTM and product-led growth (PLG).
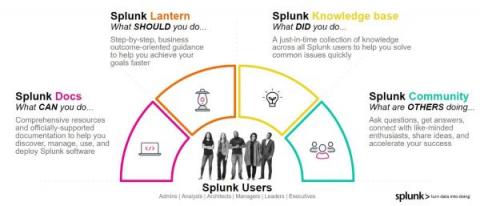
Help Yourself to Splunk Knowledge
How do I…? During your time as a Splunk customer, you will begin many of your questions this way. Our products have a lot of features to grasp, a lot of flexibility to master, and a lot of power to help you solve your business problems. Learning how to get the maximum value out of our capabilities can take some time. That is why there are dedicated groups of Splunk knowledge workers creating content to help you take advantage of opportunities quickly.
Your Clients Financial Real-Time Data: Five Factors to Keep in Mind
Real-time data is where information is collected, immediately processed, and then delivered to users to make informed decisions at the moment. Health and fitness wearables such as Fitbits are a prime example of monitoring stats such as heart rate and the number of steps in real-time. These numbers enable both users and health professionals to identify any results, existing or potential risks, without delay.
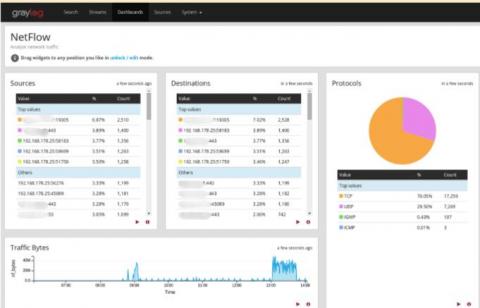
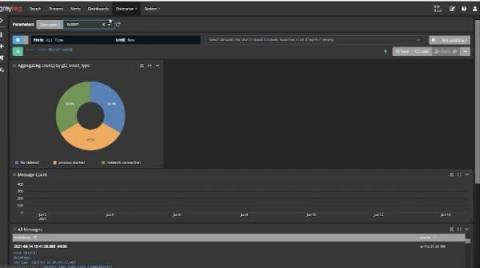
Graylog To Add Support for OpenSearch
Beginning with v4.3, which is expected to be available within a month, Graylog will add support for OpenSearch v1.1 and v1.2 as the log message and event data repository. We will continue to also support Elasticsearch v6.8 and 7.10 with this release, though Graylog Security v2.0 will require OpenSearch.
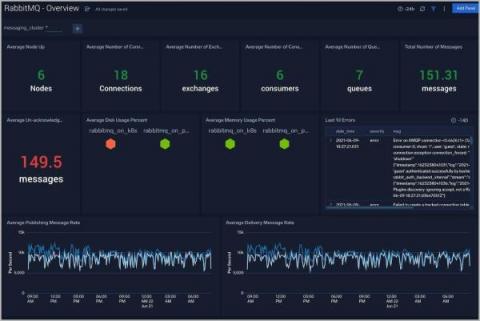
How to monitor RabbitMQ logs and metrics with Sumo Logic
AppScope 1.0: Changing the Game for Infosec, Part 1
This is one of a series of blogs in which we introduce AppScope 1.0 with stories that demonstrate how AppScope changes the game for SREs and developers, as well as Infosec, DevSecOps, and ITOps practitioners. In the coming weeks, Part 2 of this post will tackle another Infosec use case. If you’re in Infosec, at some point you’ve doubtless had to vet an application before it’s allowed to run in an enterprise environment.
How to Detect Memory Leaks in Java: Common Causes & Best Tools to Avoid Them
There are multiple reasons why Java and the Java Virtual Machine-based languages are very popular among developers. A rich ecosystem with lots of open-source frameworks that can be easily incorporated and used is only one of them. The second, in my opinion, is the automatic memory management with a powerful garbage collector. The Java garbage collector, or in short, the GC, takes care of cleaning up the unused bits and pieces.
How to Leverage Mezmo Archiving
Log archiving is the process of storing all kinds of logs (application, system, or monitoring) from across a multitude of systems in a long-term storage solution like S3. Securely collecting and keeping logs is crucial for many businesses, and they have to do it effectively and with minimal supervision.
How We Monitor Elasticsearch With Metrics and Logs
Splunk UI and the Dashboard Framework: More Visual Control Than Ever
If you attended.conf21, or followed any Splunk blogs by Lizzy Li for the past year, then you likely have heard of Splunk Dashboard Studio — our new built-in dashboarding experience included in Splunk Enterprise 8.2 and higher and Splunk Cloud Platform 8.1.2103 and higher. With new, beautiful visualizations and the ability for more visual control over the dashboard, our customers and Splunkers alike have been creating beautiful and insightful dashboards to turn data into doing.
Communication Breakdown: Deploying Datadog and New Relic Across Teams is Unwieldy
As an industry analyst at Gartner, we would often discuss whether people were in a centralized or decentralized cycle. In business, it’s normal to investigate options for creating innovation and moving quickly, or focus on reducing cost and optimizing teams and technologies.
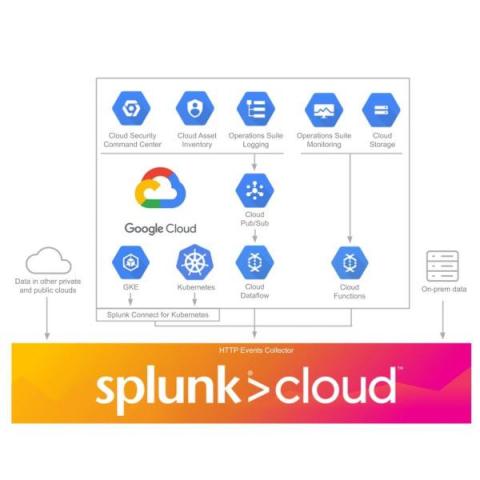
Getting Started with Splunk on Google Cloud
In April 2021, Splunk launched Splunk Cloud on Google Cloud. Since then, a large and growing number of integrations, applications, tools, and solutions have been created to enable or enhance use cases across data protection, productivity, safer remote working and other security visibility needs. We’ve highlighted a few of the more noteworthy additions below for any current or prospective users of Splunk Cloud on Google Cloud.
AppScope 1.0: Changing the Game for SREs and Devs
SREs and Devs are used to solving problems even when an awkward or inefficient way is the only way. In AppScope 1.0, SREs and Devs have a new alternative to standard methods, that the AppScope team thinks will make that problem-solving a lot more fun. We in the AppScope team constantly hear firsthand about life in the SRE trenches. For this blog, we “interview” a fictional SRE/Dev whose thoughts and comments are a mash-up of things we’ve heard from real people we know.
5 Cybersecurity Tools to Safeguard your Business
With the exponential rise in cybercrimes in the last decade, cybersecurity for businesses is no longer an option — it’s a necessity. Fuelled by the forced shift to remote working due to the pandemic, US businesses saw an alarming 50% rise in reported cyber attacks per week from 2020 to 2021. Many companies still use outdated technologies, unclear policies, and understaffed cybersecurity teams to target digital attacks.
Using Centralized Log Management for ISO 27000 and ISO 27001
As you’re settling in with your Monday morning coffee, your email pings. The subject line reads, “Documentation Request.” With the internal sigh that only happens on a Monday morning when compliance is about to change your entire to-do list, you remember it’s that time of the year again. You need to pull together the documentation for your external auditor as part of your annual ISO 27000 and ISO 27001 audit.
Understanding Log Management: Issues and Challenges
Log messages - also known as event logs, audit records, and audit trails – document computing events occurring in IT environments. Generated or triggered by the software or the user, log messages provide visibility into and documentation of almost every action on a system. So, with all that in mind, let’s explore all the biggest log management challenges of modern IT and the solutions for these problems.
Get more insights from your Java applications logs
Today it is even easier to capture logs in your Java applications. Developers can get more data with their application logs using a new version of the Cloud Logging client library for Java. The library populates the current executing context implicitly with every ingested log entry. Read this if you want to learn how to get HTTP requests and tracing information and additional metadata in your logs without writing a single line of code.
The Top 4 Reasons to Start Your Observability Pipeline Journey with Cribl.Cloud
Talk to anyone in the tech space and you’ll likely hear horror stories of how home lab setups can grow out of control or about long lists of VMs used to test various software systems. As a Criblanian, I’m no exception – I have at least a half dozen instances of Cribl LogStream deployed everywhere from my local machine, on docker containers, or on a few EC2 instances in AWS.
Searches in Loggly Simplified
Monitoring WordPress Sites With SolarWinds Papertrail
How to manage log files using logrotate
Logs are records of system events and activities that provide valuable information used to support a wide range of administrative tasks—from analyzing application performance and debugging system errors to investigating security and compliance issues. Large-scale production environments emit enormous quantities of logs, which can make them more challenging to manage and introduces the risk of losing important data if underlying resources run out of space.
How to Setup AWS CloudWatch Agent Using AWS Systems Manager
Before we jump into this, it’s important to note that older names, and still in use in some areas of AWS, are often referred to SSM which stands for Simple Systems Manager. AWS Systems Manager is designed to be a control panel for your AWS resources so you can manage them externally without having to SSH into the resources individually. What is important to remember with AWS Systems Manager is that features contained within the tool may occur additional pricing.
Using Log Management for Compliance
It’s that time of the year again. The annual and dreaded IT and security audit is ramping up. You just received the documentation list and need to pull everything together. You have too much real work to do, but you need to prove your compliance posture to this outsider. Using log management for compliance monitoring and documentation can make audits less stressful and time-consuming.
Go On, Git(Ops)
Imagine a workflow where you change and test all of your configurations in the “development” environment, committing those changes along the way, and then when you’re happy with the changes, you bundle them together in a single “pull request”, and the changes, after being reviewed by your peer(s), get pushed into production.
Logs monitoring with mtail
As of today, Bleemeo is not ingesting logs file, but you can use some external tool to ingest logs metrics which should be pretty useful as it will help you to identify issues and trigger an alarm. You will still have to connect to the machine to check logs, but trends and alarms are centralized in your favorite monitoring tool.
Logz.io Now Fully PromQL Compatible
The popularity of Prometheus speaks for itself. The project doesn’t post official numbers, but there are at least 500,000 companies using this project today as one of the most mature CNCF projects – one that has over 40k Github stars as of the writing of this blog. And since Prometheus is highly interoperable, compatibility is key. This comes into play not only with the exporters, but also with long-term storage options and alerting systems.
Sematext recognized as one of the Best Software Products by G2 and Gartner review platform communities
At Sematext, we are dedicated to making troubleshooting easier for ops teams. We knew we were doing something right when we started to receive awards and positive reviews from our customers around the globe, ranging from startups to enterprise clients across a wide range of industries. In this post, we’re listing just a few of the recognitions Sematext Cloud has received from the community via review platforms such as G2, Capterra, GetApp or SoftwareAdvice.
New in Grafana 8.4: How to use full-range log volume histograms with Grafana Loki
In the freshly released Grafana 8.4, we’ve enabled the full-range log volume histogram for the Grafana Loki data source by default. Previously, the histogram would only show the values over whatever time range the first 1,000 returned lines fell within. Now those using Explore to query Grafana Loki will see a histogram that reflects the distribution of log lines over their selected time range.
Banks are enabling personalization with Elastic - your industry can, too
Think about the moments when something is presented to you that is just what you’re looking for. Those moments, when it feels like a company you trust knows you, are all too rare in commerce. And of course, presented incorrectly, they can even feel invasive. But done well, they solidify your relationship as a customer, and reinforce that you’re getting the service you deserve.
HAProxy Monitoring Guide: Important Metrics & Best Tools in 2022
HAProxy is one of the most popular software around when it comes to load balancers and reverse proxies. When you’re using it for these purposes, it’s especially important to monitor for both availability and performance, which will impact your SLI and SLOs. In this post, we’ll talk about the main HAProxy metrics you should monitor and the best monitoring tools you can use to measure them.
Separate the Wheat from the Chaff
Since joining Cribl in July, I’ve had frequent conversations with Federal teams about observability data they collect from networks and systems, and how they use and retain this data in their SIEM tool(s). Cribl LogStream’s ability to route, shape, reduce, enrich, and replay data can play an invaluable role for Federal Agencies. Over several blogs, we will walk through the power that we bring to these requirements.
What is scripting?
Like all programming, scripting is a way of providing instructions to a computer so you can tell it what to do and when to do it. Programs can be designed to be interacted with manually by a user (by clicking buttons in the GUI or entering commands via the command prompt) or programmatically using other programs (or a mixture of both).


