Operations | Monitoring | ITSM | DevOps | Cloud


April 2022


How to Monitor Redis with OpenTelemetry

Get More Value From Your Logs Without Compromising Costs
Everyone at LogDNA is (unsurprisingly) obsessed with the power of log data. It is the single source of truth for what is happening in your environment and, when used correctly, provides the insights needed to deliver better experiences. Now more than ever, people across various teams understand the value of having easy access to log data within key workflows.

3 Key Benefits to Web Log Analysis
Whether it’s Apache, Nginx, ILS, or anything else, web servers are at the core of online services, and web log analysis can reveal a treasure trove of information. These logs may be hidden away in many files on disk, split by HTTP status code, timestamp, or agent, among other possibilities. Web access logs are typically analyzed to troubleshoot operational issues, but there is so much more insight that you can draw from this data, from SEO to user experience.

High-Performance Javascript in Stream - Why the Function in Your Filter Matters
Being a Cribl Pack author, I frequently receive questions related to why I chose to implement a certain functionality inside my Packs the way I did. A few lives ago, I worked for a Fortune 250 oil & gas company where I managed our SIEM environment. We didn’t have much in terms of system resources, so we needed to make everything run as efficiently as possible. (Maybe that’s where I get my love for performance from?)

Apache Kafka Consumer Lag Monitoring
The world lives by processing the data. Humans process the data – each sound we hear, each picture we see – everything is data for our brain. The same goes for modern applications and algorithms – the data is the fuel that allows them to function and provide useful features. Even though such thinking is not new, what is new in recent years is the requirement of near-real-time processing of large quantities of events processed by our systems.

Kubernetes Incident Response Best Practices
Inevitably, organizations that use technology (regardless of the extent) will have something, somewhere, go wrong. The key to a successful organization is to have the tools and processes in place to handle these incidents and get systems restored in a repeatable and reliable way in as little time as possible.
CI/CD & DevOps Pipeline Analytics: A Primer
Tracking application-level and infrastructure-level metrics is part of what it takes to deliver software successfully. These metrics provide deep visibility into application environments, allowing teams to home in on performance issues that arise from within applications or infrastructure. What application and infrastructure metrics can’t deliver, however — at least not on their own — is breadth.

Real User Monitoring vs Synthetic Monitoring Comparison: What Should You Use? | Sematext

Elastic on Elastic: How we saved $100,000/month by keeping our own software up to date
Let's start with the bottom line: When we upgraded to Elasticsearch 7.15 last year, our internal observability clusters saw a reduction in inter-node traffic from 464TB to 204.5TB per day. We monitored this reduction through subsequent upgrades and noticed its impact on our data transfer and storage costs. So here it is: upgrading saved Elastic $3,500 per day, or approximately $100,000 a month, or $1.2 million annually.
AppScope 1.0: Changing the Game for Infosec, Part 2
We’re introducing AppScope 1.0 with a series of stories that demonstrate how AppScope changes the game for SREs and developers, as well as Infosec, DevSecOps, and ITOps practitioners. This blog is the second of two Infosec stories. For both Part 1 and Part 2, Randy Rinehart, Principal Product Security Engineer at Cribl, contributed extensively.

Coralogix Platform Demo

Using Synthetic Endpoints to Quality Check your Platform
Quality control and observability of your platform are critical for any customer-facing application. Businesses need to understand their user’s experience in every step of the app or webpage. User engagement can often depend on how well your platform functions, and responding quickly to problems can make a big difference in your application’s success. AWS Canaries can help companies simulate and understand the user experience.

Slack's New Logging Storage Engine Challenges Elasticsearch
Elasticsearch has long been the prominent solution for log management and analytics. Cloud-native and microservices architectures, together with the surge in workload volumes and diversity, have surfaced some challenges for web-scale enterprises such as Slack and Twitter. My podcast guest Suman Karumuri, a Sr. Staff software engineer at Slack, has made a career on solving this problem. In my chat with Suman, he discusses for the first time in a public space a new project from his team at Slack: KalDB.

C-Suite Reporting with Log Management
When security analysts choose technology, they approach the process like a mechanic looking to purchase a car. They want to look under the hood and see how the product works. They need to evaluate the product as a technologist. On the other hand, the c-suite has different evaluation criteria. Senior leadership approaches the process like a consumer buying a car.
Using AI & ML for Application Performance (APM)
Today, IT and site reliability engineering (SRE) teams face pressure to remediate problems faster than ever, within environments that are larger than ever, while contending with architectures that are more complex than ever. In the face of these challenges, artificial intelligence has become a must-have feature for managing complex application performance or availability problems at scale.
Cloud Log Management Strategy & Best Practices
For IT Operations and Site Reliability Engineering (SRE) teams, logging is nothing new. In fact, collecting and analyzing logs is one of the oldest cornerstones of performance management. Logs have been part and parcel of APM workflows for decades. Yet the logging strategies that worked in eras past often fall short today. That’s thanks to the advent of cloud-native computing, which has ushered in fundamental new challenges in the way teams aggregate, analyze, and manage logs.

Continuous Performance Management Basics
In this blog post, we will walk you through how to develop a continuous performance management playbook for your business to effectively integrate and manage performance as an integral part of your development process – enabling you to build fast experiences faster than your competition. Let’s dive in!

Are You Curious? Announcing the Launch of Cribl Curious: A Q&A Site for the Cribl-Inclined
Our amazing user community is growing so fast that we want to give you more resources to learn and share your knowledge and experience with others. So…today we launch Cribl Curious! Curious is a Q&A site for asking and answering technical questions about Cribl Stream, Cloud, Edge, Packs, and AppScope. Goat a question about how something works in Cribl? Come on over to see how your peers have solved similar problems. Checked the docs and it’s just not clicking for you?

Announcing new simple query options in Cloud Logging
When you’re troubleshooting an issue, finding the root cause often involves finding specific logs generated by infrastructure and application code. The faster you can find logs, the faster you can confirm or refute your hypothesis about the root cause and resolve the issue! Today, we’re pleased to announce a dramatically simpler way to find logs in Logs Explorer.

Why Is Normalizing Log Data in a Centralized Logging Setup Important: Operations & Security
The phone rings. Your email pings. Your marketing team just told you about a flood of messages on social media and through live chat that there’s a service outage. You thought your Monday morning would be calm and relaxed since people are just returning from the weekend. How do you start researching all of these incoming tickets? How do you know which ones to handle first? Is this just a hardware failure, or are you about to embark on a security incident investigation like Log4j?
On-Premises Application Monitoring: An Introduction
In the present age of cloud-native everything, it can be easy to forget that some applications still run on-premises. But they do and managing the performance of on-premises apps is just as important as monitoring those that run in the cloud. With that reality in mind, here’s a primer on how to approach on-premises application performance monitoring as part of a broader cloud-native performance optimization strategy.
Kubernetes Monitoring: An Introduction
One of the first things you’ll learn when you start managing application performance in Kubernetes is that doing so is, in a word, complicated. No matter how well you’ve mastered performance monitoring for conventional applications, it’s easy to find yourself lost inside a Kubernetes cluster.

Papertrail Now A DigitalOcean SaaS Add-On

How SAP built a Dojo Community of Practice to support a cultural shift to DevOps
Distributed Tracing Best Practices for Microservices
The management of modern software environments hinges on the three so-called “pillars of observability”: logs, metrics and traces. Each of these data sources provides crucial visibility into applications and the infrastructure hosting them. For many IT operations and site reliability engineering (SRE) teams, two of these pillars — logs and metrics — are familiar enough.


Enable OpenSearch Log Integration

Coralogix's Streama Technology: The Ultimate Party Bouncer
Coralogix is not just another monitoring or observability platform. We’re using our unique Streama technology to analyze data without needing to index it so teams can get deeper insights and long-term trend analysis without relying on expensive storage.

How to Keep DevOps in Sync with Business Needs

Splunk Operator 1.1.0 Released: Monitoring Console Strikes Back!
The latest version of the Splunk Operator builds upon the release we made last year with a whole host of new features and fixes. We like Kubernetes for Splunk since it allows us to automate away a lot of the Splunk Administrative toil needed to set up and run distributed environments. It also brings a resiliency and ease of scale to our heavy-lifting components like Search Heads and Indexer Clusters.

Why is Application Performance Monitoring Important?
Picture this: Your on-call engineer gets an alert at 2 AM about a system outage, which requires the entire team to work hours into the night. Even worse, your engineering team has no context of where the issue lies because your systems are too distributed. Solving the problem requires them to have data from resources that live in another timezone and aren’t responsive. All the while, your customers cannot access or interact with your application, which, as you can imagine, is damaging.

Leveraging Elastic to improving data management and observability in the cloud
Two recent studies conducted by Nucleus Research, focused on how a global telecommunications provider, and multi-line insurance company realized quantified business value through Elastic. The companies that were studied saw great levels of satisfaction from deploying Elastic Cloud. Through their adoption they were able to increase the maturity of their tech stack and circumvent prior limitations in scalability.
Troubleshooting Sources and Destinations in Cribl Stream
This is Part One of a series of blogs around troubleshooting Cribl Stream. Part One will focus on identifying and troubleshooting issues with Sources and Destinations in Stream. I will cover some of the common problems that users face and how you can work through them and find the root cause.
ZScaler Event Optimization with Cribl Stream
ZScaler delivers a suite of well-regarded products for helping IT securely move from network infrastructure to the cloud, using principles of zero trust. According to their website, they have 5,600+ customers and process 200B+ daily transactions.

Tools for Threat Hunting and IT Service Risk Monitoring
Cybersecurity can often seem intimidating for IT teams. After all, things like “threat hunting,” “red teaming,” and “blue teaming” are not used in IT operations. On the other hand, just because these words are terms of art doesn’t mean that they’re activities you don’t do already. You’re probably already using log data as part of your IT operations incident response.

What is Splunk? (2022)

Ask Miss O11y: Logs vs. Traces
Ah, good question! TL;DR: Trace instead of log. Traces show connection, performance, concurrency, and causality. Logs are the original observability, right? Back in the day, I did all my debugging with `printf.` Sometimes I still write `console.log(“JESS WAS HERE”)` to see that my code ran. That’s instrumentation, technically. What if I emitted a “JESS WAS HERE” span instead? What’s so great about a span in a trace? Yeah, and so do logs in any decent framework.

The ins, outs, and benefits of using Grafana Loki as a backend logging solution

Intro to FREE Cribl Sandboxes & Preparing for Upcoming Privacy Regulations

Linux Command Cheat Sheet
As we know that many of our users are system administrators, network and software engineers as well as cloud infrastructure leaders who use Linux primarily, we've created a helpful cheat sheet as a reference guide to help you with understanding the most common Linux commands. Feel free to save the sheet below and share it with any team members that you think would appreciate learning some of the most essential commands for Linux.
How I Stream: Solving Tricky Security Challenges and Optimizing Splunk
Greetings Criblers! We’re introducing a new series by the Criblers, for the Criblers called How I Stream! Each month (maybe more frequently–you, too can be featured, share your insights here), we’ll share a quick profile from one of our community GOATS (Greatest of All Time Streamers) sharing use cases and lessons learned. Our first guest goes by Hobbit in the community.

Kubernetes: Tips, Tricks, Pitfalls, and More
If you’re involved in IT, you’ve likely come across the word “Kubernetes.” It’s a Greek word that means “boat.” It’s one of the most exciting developments in cloud-native hosting in years. Kubernetes has unlocked a new universe of reliability, scalability, and observability, changing how organizations behave and redefining what’s possible. But what exactly is it?

Accelerate incident investigations with Log Anomaly Detection
Modern DevOps teams that run dynamic, ephemeral environments (e.g., serverless) often struggle to keep up with the ever-increasing volume of logs, making it even more difficult to ensure that engineers can effectively troubleshoot incidents. During an incident, the trial-and-error process of finding and confirming which logs are relevant to your investigation can be time consuming and laborious. This results in employee frustration, degraded performance for customers, and lost revenue.
Lights, Camera, Action: Introducing The Fellowship of the Stream
Last week, an article from SiliconAngle came out detailing the challenges facing cybersecurity professionals. Companies are in desperate need of solutions to deal with cloud-native applications that exist in fast-paced environments. The security and IT teams monitoring these applications need scalable and flexible solutions that drive actionable insights. That’s why we built Cribl Stream.

Tackling Your Carbon Footprint with the Sustainability Toolkit for Splunk
Simple questions can be overwhelming and not knowing the answer after a mouse click is no longer an option: Sustainability is top of mind for organizations across all verticals and Splunk can help with the power of data. Our upcoming Sustainability Toolkit based on the Splunk platform equips organizations with capabilities to gain deep insights into their carbon footprint and as such empowers them to take the necessary actions towards their carbon neutrality goals.

Use Service Design in Operations Management to Enhance Security
As an IT operations manager, you spend a lot of your time mitigating service outages and service level risks. You worked diligently to get the right people, products, processes, and partners in place to meet your goals. You managed to ensure continued uptime. You’ve reduced the number of tickets and the cost per ticket. And for your efforts, you’re rewarded with managing your company’s cybersecurity program. The problem? You’re not a security specialist.

Log Observer Connect: Leverage the power of Splunk Enterprise data in Splunk Observability Cloud

How to Use OpenTelemetry to Troubleshoot a Serverless Environment with StackState
Losing track of communication between applications or code has become a problem with the tech world growing more into supporting Serverless cloud architectures and allowing the developer to maintain, upgrade and update these services. One might say that services and code are becoming more loosely coupled, allowing code to run and execute in silos. Let's take an AWS Lambda function as an example.
Investigating issues with performance in Puppet Enterprise, Part 2 - Agent Logging
Slack's New Metrics Storage Engine Challenges Prometheus
Metrics storage engines must be specially engineered to accommodate the quirks of metrics time-series data. Prometheus is probably the most popular metrics storage engine today, powering numerous services including our own Logz.io Infrastructure Monitoring. But Prometheus was not enough for Slack given their web-scale operation. They set out to design a new storage engine that can yield 10x more write throughput, and 3x more read throughput than Prometheus! In February 2022 Suman Karumuri, Sr.

Elasticsearch Release: Roundup of Change in Version 8.1.0
Elastic released a major version of its platform on February 10, 2022. Version 8.0.0 is the latest major version. There has already been a new minor release to version 8.1.0, and there are anticipated minor and patch releases coming as Elastic rolls out new features and fixes. The latest release is the first significant revision since April 2019, when version 7.0.0 was generally available. Users can find a complete list of release notes on the Elastic website.
The Bird is the Word: Getting Up and Running Fast on Humio, by Crowdstrike
I’ve been in the log data analytics space for years, and I have loved seeing the technology and methodologies change and evolve. One of my favorite changes has been the emergence of index-less solutions, and Humio has a great solution here. If you haven’t heard of Humio, you should check out their index-less log management solution for yourself (free up to 16 GB/day too).

New in Grafana Loki 2.5: Faster queries, more log sources, so long S3 rate limits, and more!
I’m very excited to tell you all about the latest Grafana Loki installment, 2.5! A huge amount of work, nearly 500 PRs, has gone into Loki between v2.4 and now. The major themes for this release are improved performance, continuing ease of operations, and more ways to ingest your logs. I usually find myself the most excited about performance improvements, so let’s start there.

It's time to switch! Sumo Logic cloud-native platform.

The Fellowship of the Stream: Unlock Radical Levels of Choice & Control with Observability Data
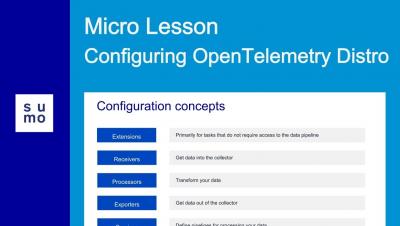
Micro Lesson: Configuring OpenTelemetry Distro


Unlock Radical Levels of Choice & Control with Cribl


How to Identify Memory Leaks
You may not be familiar with thinking about the memory usage of your applications as a software developer. Memory is plentiful and usually relatively fast in today's development world. Likely, the programming language you're using doesn't require you to allocate or free memory on your own. However, this does not mean you are safe from memory leaks. Memory leaks can occur in any application written in any language. Sure, older or "near to the metal" languages like C or C++ have more of them.

What is the Most Vulnerable Data My Company Holds?
Data security is on every priority list in 2022. With the frequency of breaches never higher, many businesses assess their situation and ask cybersecurity questions. With cybersecurity policy, everything boils down to risk. Ultimately, every decision-maker wants to know, “how likely are we to be attacked?” Many believe cybercriminals only target certain kinds of data. Sensitive information, high-value financial data, and medical records are all widely accepted to carry a high risk.

Azure AD Audit Logs
Azure Active Directory (Azure AD) is Microsoft’s multi-tenant, cloud-based Identity and Access Management (IAM) service. It takes care of authentication and authorization of user and application identities.

Using Log Management as a Security Analytics Platform
With the rising tide of data breach awareness, your senior leadership is asking you to mitigate cybersecurity risk with security analytics. You’ve built up the use cases and started researching different platforms. Then, you realized: you’re not sure you have the budget. The typical security analytics platforms come with upfront technology costs as well as the “hidden fees” associated with training your team members. You know you need to use analytics to help mitigate risk.

Spring4Shell Zero-Day Vulnerability: Overview and Alert Upon Detection for CVE-2022-22965
On March 29, 2022, a critical vulnerability targeting the Spring Java framework was disclosed by VMware. This severe vulnerability is identified as a separate vulnerability inside Spring Core, tracked as CVE-2022-22965 and canonically named “Spring4Shell” or “SpringShell”, leveraging class injection leading to a full remote code execution (RCE).
Are You GDPR-Aware?
Since 2018, General Data Protection Regulation (GDPR) has been on everyone’s lips – and for good reason. It’s the gold standard for consumer protection. While privacy laws present challenges to enterprises big and small, we can’t escape the reality that consumer data is constantly mined and sold.

Top Trends in Cybersecurity 2022: A Gartner Report
Gartner recently released a report highlighting the top trends in cybersecurity for 2022. They discuss how businesses must reframe their security practices, rethink their technology, and adopt new responses to modern threats. This is in line with DevSecOps trends that we see in the market and hear about from our customers. Companies that are working in this way are taking a more holistic approach to cybersecurity by adopting tools that speed up and, when possible, automate security.

Who Owns Observability In Enterprises?
It’s common sense. When a logstorm hits, you don’t want to be left scrambling to find the one engineer from each team in your organization that actually understands the logging system – then spending even more time mapping the logging format of each team with the formats of every other team, all before you can begin to respond to the incident at hand. It’s a model that simply won’t scale.

Micro Lesson: Introducing OpenTelemetry

What to Watch on EKS - a Guide to Kubernetes Monitoring on AWS
It’s impossible to ignore AWS as a major player in the public cloud space. With $13.5billion in revenue in the first quarter of 2021 alone, Amazon’s biggest earner is ubiquitous in the technology world. Its success can be attributed to the wide variety of services available, which are rapidly developed to match industry trends and requirements.

Logging Best Practices - MDC, Ingestion and Scale
I don’t care about religious wars over “which logger is the best”. They all have their issues. Having said that, the worst logger is probably the one built “in-house”… So yes, they suck, but re-inventing the wheel is probably far worse. Let’s discuss making these loggers suck less with proper usage guidelines that range from the obvious to subtle. Hopefully, you can use this post as the basis of your company’s standard for logging best practices.

Application observability made easier for Compute Engine
When IT operators and architects begin their journey with Google Cloud, Day 0 observability needs tend to focus on infrastructure and aim to address questions about resource needs, a plan for scaling, and similar considerations. During this phase, developers and DevOps engineers also make a plan for how to get deep observability into the performance of third-party and open-source applications running on their Compute Engine VMs.

Security intelligence analytics: Planning Increases ROI
It’s been a week. A long week. After the most recent Board of Directors meeting, your senior leadership tasked you with finding a security analytics solution. Over the last month, you’ve worked with leadership to develop some basic use cases to determine which solution meets your security and budget needs. You started your research, but everything on the market seems really overwhelming.

Introducing LogDNA Agent 3.4
In our ongoing efforts to provide our customers with a best-in-class log management solution, we’re excited to launch improvements to our Agent. This new, robust version (3.4) provides significant performance improvements for our customers. Specifically, we focused on two main areas of the Agent: error handling and endurance.

A primer to understanding observability
The one certainty you will find in IT, developer, and SRE roles is that things always change! One hot topic in DevOps communities is observability. A long word, you may be wondering what it really means and how you can add it to your skillset. Here’s a quick primer to get you going on your path to observability.
Spring4Shell: Responding to Zero-Day Threats with the Right Data
On March 30th, 2022, rumors began to swirl around a GitHub commit from a researcher containing proof of concept (POC) exploit code. The exploit targeted a zero-day in the Spring Core module of the Spring Framework, and was quickly confirmed against specific versions of Spring Core with JDK 9 and above. Anything running Tomcat is most at risk given the POC was based on Tomcat apps. This threat posture will evolve over time as new vectors and payloads are discovered and distributed.

Source-Side Queueing: You Down With UDP?
Source-side queueing is a fancy way of saying: You can configure Cribl products to make sure data isn’t lost in the event of downstream backpressure, again. Those familiar with Cribl Stream might be aware of destination queuing or persistent queuing, wherein Stream can write data to the local disk in the event of an issue reaching the destination. Maybe your SIEM is suffering from disk I/O latency. Maybe there is a DNS problem with your load balancer (Hint: It’s always DNS).

How to upgrade your Elastic Cloud deployment

Splunk Embarks on AWS Graviton Journey with Amazon EC2 Im4gn and Is4gen Instances
We are excited to announce that Splunk Cloud Platform is moving to next generation AWS Graviton2 processor hardware to help enable enhanced performance for customers who choose AWS as a provider. This begins a phased transition of our Splunk Cloud Platform indexer tier in a move that will help Splunk operate more efficiently and provide customers with the cutting edge in processing technology.